
Table1: Template for baseline characteristics of patients
Table of Contents
- 1 Introduction
- 2 How to use it
- 3 Syntax
- 4 A simple example
- 5 Choosing statistics with different variables
- 6. Example of choosing statistics
- 7. Using it with the survey prefix svy:
- 8. Example of using it the survey prefix svy:
- 9. Additional examples
- 10. Report a single statistic
- 11. When the treatvar has multiple categories
Introduction
The table1 template is an asdocx package that creates “Table 1”, i.e., patient baseline characteristics table commonly found in biomedical research papers. The template can summarize different types of variables such as continuous and categorical variables in a single table.
 Using table1 template
The template is free. However, it requires asdocx package, that is currently available at 80% discount for a limited time. The template file is installed automatically when you install asdocx.
After installation of the template, you can use the template as shown below.
 Syntax of table1 template
asdocx tab treatvar basevars, factor(stats) continuous(stats)
       binary(stats) template(table1) report(cat) cell row col
 Syntax Details
The syntax starts with the keywords asdocx tab.
The treatvar is the treatment variable, the variable that holds information of the treatment group and placebo groups.
The basevars are all other variables that represent the basic characteristics of the participants.
Option template(table1) invokes the table1 template.
The option report(cat) allows you to specify a specific category of a categorical variable to report in your output. By default, all categories are included in the report. For example, when working with a binary variable, you can use this option to only report one category (e.g. category 1) and exclude the other (e.g. category 0). It’s worth noting that even though the output may only show one category, all categories are still used in the calculation of relevant statistics.
 A Simple Example
* Load example dataset
use http://fintechprofessor.com/asdocxAddins/table1.dta, clear

* Make table 1 using the template(table1) option
asdocx tab immigrant bone_arthritis bone_backspin              ///
       bone_backother bone_neck bone_fibro bone_lupus         ///
       bone_ehlers bone_deform bone_amp bone_burn nervous_ms  ///
       nervous_seizure nervous_park nervous_stroke           ///
       other_otherhealth other_anyother ,                   ///
       template(table1) table_layout(autofit) replace
In the above example, the variable immigrant is the treatvar and all other variables are basevars. After comma, option template(table1) causes asdocx to use the table1 template. The table_layout(autofit) creates a table with tight autofit of contents. The above code should generate the following table.
| Variables | Non-Immigrant (n=670) | Immigrant (n = 108) | Total (778) | P-value |
|---|---|---|---|---|
| Arthritis | 0.27 | |||
|
No arthritis
|
95 (13.07%) | 11 (1.51%) | 106 (14.58%) | |
|
Arthritis
|
532 (73.18%) | 89 (12.24%) | 621 (85.42%) | |
| Back pain due to spinal stenosis | 0.09 | |||
|
No back pain due to spinal st~
|
609 (83.77%) | 100 (13.76%) | 709 (97.52%) | |
|
Back pain due to spinal sten~
|
18 (2.48%) | 0 (0.00%) | 18 (2.48%) | |
| Back pain due to other causes | . | |||
|
Back pain due to other causes
|
670 (86.12%) | 108 (13.88%) | 778 (100.%) | |
| Neck pain | 0.24 | |||
|
No neck pain
|
536 (73.73%) | 81 (11.14%) | 617 (84.87%) | |
|
Neck pain
|
91 (12.52%) | 19 (2.61%) | 110 (15.13%) | |
| Fibromyalgia | 0.68 | |||
|
No fibromyalgia
|
610 (83.91%) | 98 (13.48%) | 708 (97.39%) | |
|
Fibromyalgia
|
17 (2.34%) | 2 (0.28%) | 19 (2.61%) | |
| Lupus | 0.51 | |||
|
No lupus
|
624 (85.83%) | 99 (13.62%) | 723 (99.45%) | |
|
Lupus
|
3 (0.41%) | 1 (0.14%) | 4 (0.55%) | |
| Ehlers-Danlos Syndrome | 0.69 | |||
|
No Ehlers-Danlos syndrome
|
626 (86.11%) | 100 (13.76%) | 726 (99.86%) | |
|
Ehlers-Danlos Syndrome
|
1 (0.14%) | 0 (0.00%) | 1 (0.14%) | |
| Deformity of limb | 0.42 | |||
|
No deformity of limb
|
623 (85.69%) | 100 (13.76%) | 723 (99.45%) | |
|
Deformity of limb
|
4 (0.55%) | 0 (0.00%) | 4 (0.55%) | |
| Amputation of limb | 0.14 | |||
|
No amputation of limb
|
626 (86.11%) | 99 (13.62%) | 725 (99.72%) | |
|
Amputation of limb
|
1 (0.14%) | 1 (0.14%) | 2 (0.28%) | |
| Severe burn | 0.57 | |||
|
No severe burn
|
625 (85.97%) | 100 (13.76%) | 725 (99.72%) | |
|
Severe burn
|
2 (0.28%) | 0 (0.00%) | 2 (0.28%) | |
| Multiple sclerosis | 0.51 | |||
|
No multiple sclerosis
|
624 (85.83%) | 99 (13.62%) | 723 (99.45%) | |
|
Multiple sclerosis
|
3 (0.41%) | 1 (0.14%) | 4 (0.55%) | |
| Seizure disorder | 0.37 | |||
|
No seizure disorder
|
622 (85.56%) | 100 (13.76%) | 722 (99.31%) | |
|
Seizure disorder
|
5 (0.69%) | 0 (0.00%) | 5 (0.69%) | |
| Parkinson’s Disease | . | |||
|
No Parkinson’s disease
|
627 (86.24%) | 100 (13.76%) | 727 (100%) | |
|
Parkinson’s Disease
|
. (.%) | . (.%) | . (.%) | |
| Stroke (or effects of a prior st~ | 0.84 | |||
|
No stroke (or effects of a prior
|
622 (85.56%) | 99 (13.62%) | 721 (99.17%) | |
|
Stroke (or effects of a prior
|
5 (0.69%) | 1 (0.14%) | 6 (0.83%) | |
| Other health problem | 0.86 | |||
|
No other health problem
|
593 (81.57%) | 95 (13.07%) | 688 (94.64%) | |
|
Other health problem
|
34 (4.68%) | 5 (0.69%) | 39 (5.36%) | |
| Any other serious health problems | 0.16 | |||
|
No other serious health prob~
|
399 (51.29%) | 72 (9.25%) | 471 (60.54%) | |
|
Any other serious health pro~
|
271 (34.83%) | 36 (4.63%) | 307 (39.46%) |
 Choosing Statistics
Table1 template allows different statistics with categorical / factor variables, continuous variables, and binary variables. The allowed statistics are given below:
| Option
|
Details
|
|
|---|---|---|
| mean | Mean of the variable | |
| sd | Standard deviation of the variables | |
| ci | 95% Confidence interval | |
| n | Counts | |
| N | Counts | |
| frequency | Counts | |
| percentage | Count as Percentage of total * | |
| % | Count as percentage of total | |
| perc | Count as percentage of total | |
| median | Median | |
| iqr
|
first and third quartiles
|
|
*The default is to report cell percentages. Option row or col can be used to report row or column percentages. |
||
The statistics presented in the above table can be selectively used with categorical, binary, and continuous variables. The default statistics for each type of variables are given below:
(1) Binary variables : Count (Percentages)
(2) Categorical variables : Count (Percentages)
(3) Continuous variables : Mean (95% confidence interval)
Binary and continuous variables are identified internally by asdocx. To declare a variable as categorical, we need to add i. as a prefix to the variable name. Two statistics can be reported with each type of variables. The first statistic is accompanied by the second one in brackets. Therefore, if we were to report frequency counts and percentages with categorical variable ed, we would write it as i.ed and also add the option cat(N %) or cat(n %) or cat(count perc). Let’s also report mean and confidence interval with continuous variables, therefore, use the option continuous(mean ci).
Example of Choosing Statistics
* Load example dataset
use http://fintechprofessor.com/asdocxAddins/svy.dta, clear
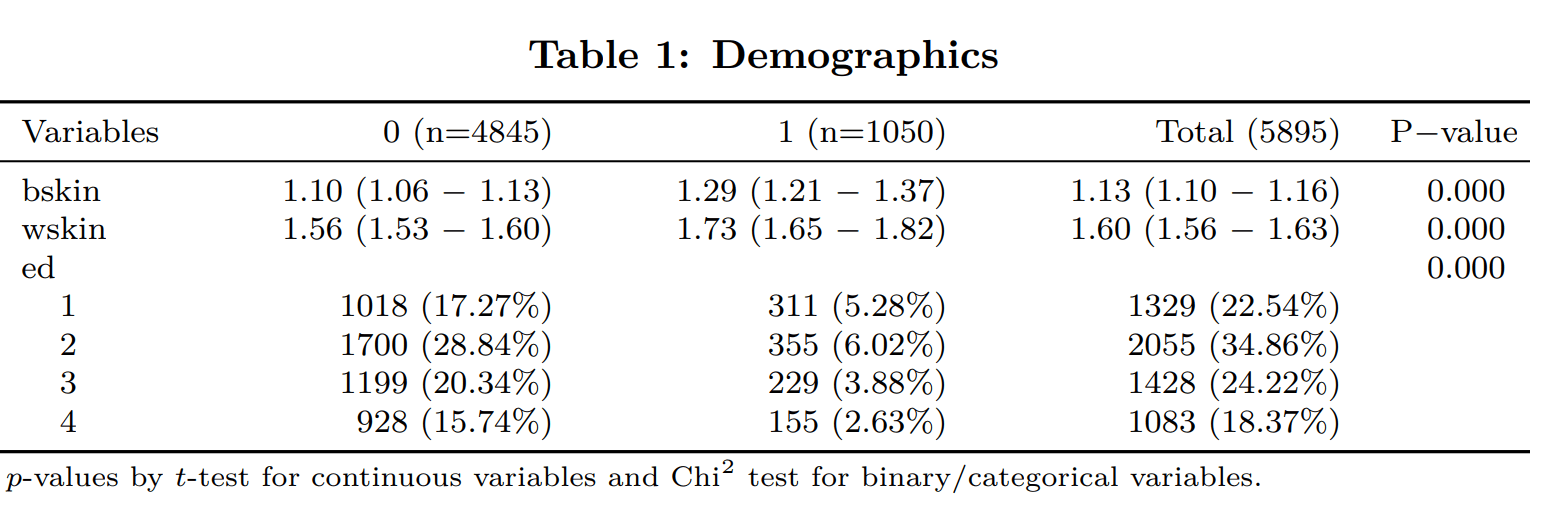
asdocx tab back bskin wskin i.ed, factor(N %) continuous(mean ci) ///
template(table1) table_layout(autofit) replace
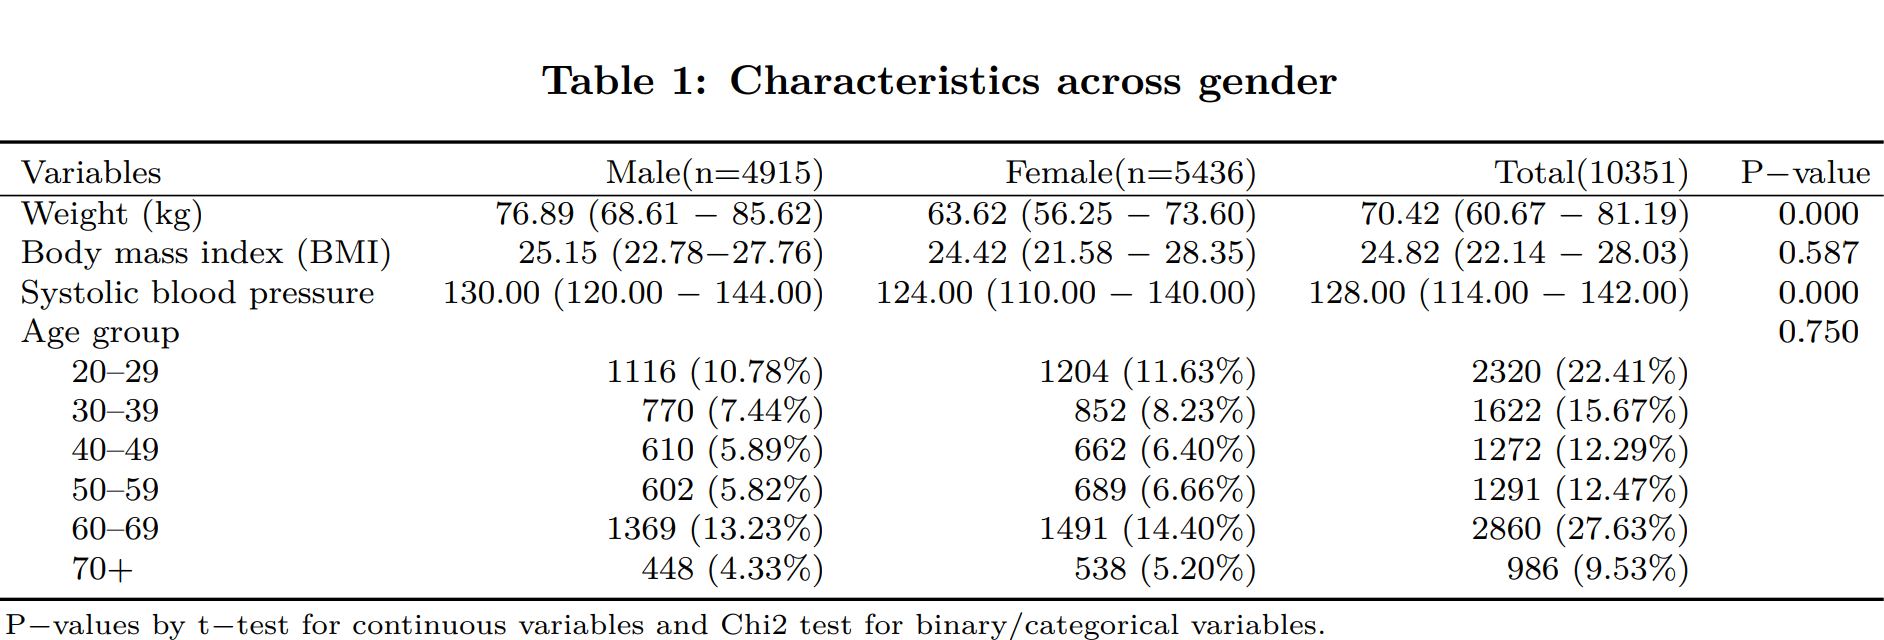
Example: Report median, first and third quartiles
Let’s construct another table that reports median, first and third quartiles for all continuous variables. To do this, we shall use the continuous(median iqr) option. Note that specifying iqr tells asdocx to report both the first and third quartiles. For this iteration, we will export the table in LaTeX format by using the .tex extension with the filename in the save() option.
webuse nhanes2

asdocx tab sex weight bmi bpsystol i.agegrp, template(table1) ///
replace continuous(median iqr) save(MyFile.tex) title(Table 1: Characteristics across gender)
 Using it with Survey prefix svy:
Using template table1 with survey data is not much different than using any other Stata command with the svy: prefix. As a first step, declare the data as survey data and then add the svy: prefix before the tab word. Then all the statistics reported by template1 will have survey weights. See the following example
* Load example dataset
use http://fintechprofessor.com/asdocxAddins/svy.dta, clear
* set the survey parameters
svyset SECLUSTR [pweight=NSALWTCT], strata(SESTRAT)
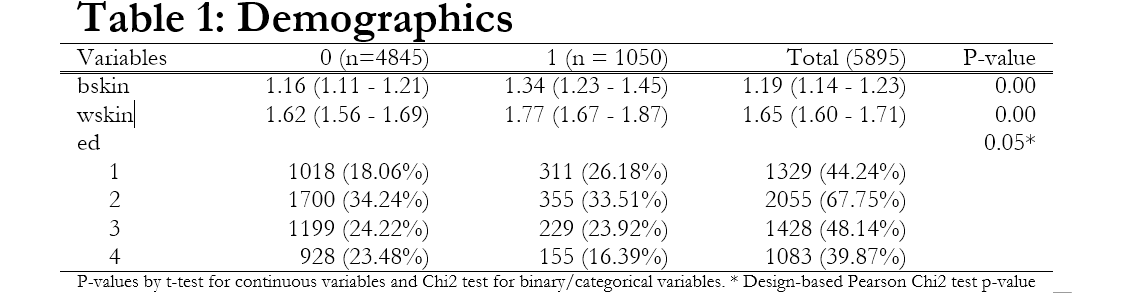
asdocx svy: tab back bskin wskin i.ed, factor(N %) continuous(mean ci) ///
template(table1) table_layout(autofit) replace
 More Examples
The default is to report cell percentages. If percentages need to be based on column total or row total, then option col or row must be used. The following two examples show this.
 Multiple categories of the treatvar
This post shows various examples of using template(table1) when the treatment variable has more than two categories. If you are new to asdocx or to the template(table1), you may like to start with the basic introduction to Table1 template here.
Several asdocx users requested to add support for multiple categories of the treatment variable. In asdocx version 2.1.2 (Aug 17, 2022) this is now possible. Following are few examples:
Example data
use http://fintechprofessor.com/asdocxAddins/table1svy, clear

* Create a dummy variable to use it a continuous variable
gen pincome = id / 10000

* Create value lable for gener
label define genderlable 1 "Female" 0 "Male"

* assign values
label value gender genderlable
Continuous variables
   *1. mean ci - for comparison, firstoutput from Stata

   	mean pincome, over(mi_final)

Mean estimation                         Number of obs   =     18,076

--------------------------------------------------------------------
                   |       Mean   Std. Err.     [95% Conf. Interval]
-------------------+------------------------------------------------
c.pincome@mi_final |
             none  |   4.937284   .0184639      4.901093    4.973475
            stemi  |    4.65329   .4590964      3.753418    5.553163
           nstemi  |   5.241515   .2427136      4.765773    5.717256
           Type 2  |   4.401919   .4269773      3.565002    5.238835
--------------------------------------------------------------------

	asdocx tab mi_final pincome , template(table1) replace landscape  cont(mean ci)
| Variables | none (n=17932) | stemi (n=21) | nstemi (n=96) | Type 2 (n=27) | Total (18076) | P-value |
|---|---|---|---|---|---|---|
| pincome | 4.937 (4.901 – 4.973) | 4.653 (3.753 – 5.553) | 5.242 (4.766 – 5.717) | 4.402 (3.565 – 5.239) | 4.938 (4.902 – 4.974) | 0.887 |
| P-values by t-test for continuous variables and Chi2 test for binary/categorical variables. | ||||||
   *2. svy mean ci

svyset id [pweight=dwt], vce(linearized)
svy: mean income, over(mi_final)
--------------------------------------------------------------------
                   |             Linearized
                   |       Mean   Std. Err.     [95% Conf. Interval]
-------------------+------------------------------------------------
c.pincome@mi_final |
             none  |   4.937284    .056669      4.826177     5.04839
            stemi  |   4.653291   .4480933       3.77475    5.531833
           nstemi  |   5.241515    .248015      4.755251    5.727779
           Type 2  |    4.40192   .4190554      3.580311     5.22353
--------------------------------------------------------------------

    svy: mean pincome, over(mi_final)
    asdocx svy: tab mi_final pincome, template(table1) replace ///
    landscape cont(mean ci)
| Variables | none (n=17932) | stemi (n=21) | nstemi (n=96) | Type 2 (n=27) | Total (18076) | P-value |
|---|---|---|---|---|---|---|
| pincome | 4.937 (4.826 – 5.048) | 4.653 (3.775 – 5.532) | 5.242 (4.755 – 5.728) | 4.402 (3.580 – 5.224) | 4.938 (4.827 – 5.049) | 0.887 |
| P-values by t-test for continuous variables and Chi2 test for binary/categorical variables. | ||||||
    *3. mean sd
    mean pincome, over(mi_final)
	estat sd
	asdocx tab mi_final pincome, template(table1) replace ///
        landscape cont(mean sd)

   *4. svy mean sd
    svy:mean pincome, over(mi_final)
	estat sd
	asdocx svy:tab mi_final pincome , template(table1) ///
        landscape  cont(mean sd)
*------------------------------------------------------------------------------
**# 		Factor variables (gender is a factor variable)
*=============================================================================*/


   *1. count and cell percentage
   	tab gender mi_final, cell
	asdocx  tab mi_final pincome gender, template(table1) ///
        replace landscape cont(mean sd) cell

   *2. count and row percentage
   	tab gender mi_final, row
	asdocx tab mi_final pincome gender, template(table1) ///
        replace landscape cont(mean sd) row

   *3. count and column percent
   	tab gender mi_final, col
	asdocx  tab mi_final pincome gender, template(table1) ///
        replace landscape cont(mean sd) col


   *4. svy count and cell
   	svy:tab gender mi_final, cell format(%9.5f)
	asdocx svy:tab mi_final pincome gender, template(table1) ///
        replace landscape cont(mean sd) cell

   *5. svy count and row
   	svy:tab gender mi_final,  format(%9.5f) row
	asdocx  svy:tab mi_final pincome gender, template(table1) ///
        replace landscape cont(mean sd) row

   * 6. svy count and column
   	svy:tab gender mi_final,  format(%9.5f) col
	asdocx  svy:tab mi_final pincome gender, template(table1) ///
        replace landscape cont(mean sd) col
See also:
- Table1 template when treatment variable does not exist
- Table template with svy
 Order asdocx
Yearly license of asdocx is available at $9.99. Its life-time license is available at $49.99. With the asdocx membership, you get :
- Life-time license to use
- All future updates
- All premium templates / plugins.