Exporting Graphs with asdocx
Exporting graphs and charts from Stata to a Word document using asdocx is a seamless procedure, requiring no more than prefixing asdocx to any graph or chart command. The syntax remains the same as using asdocx with any other Stata command. In the following lines, I will demonstrate how to export summary statistics and graphs in the same document, with minimal coding and impressive results.
 How to export graphs
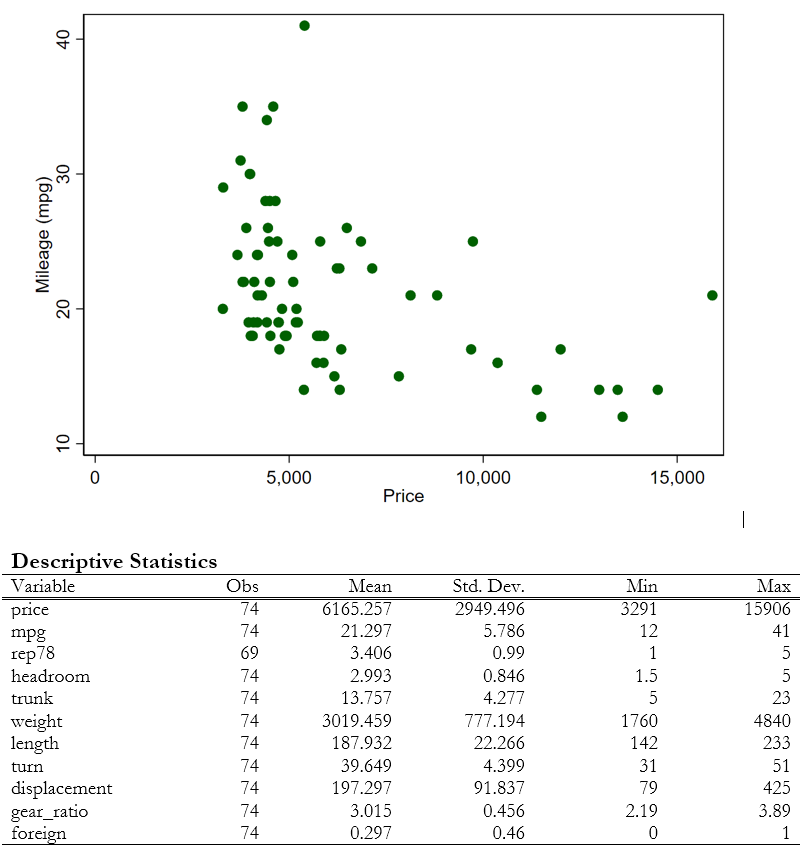
To start, I will load the auto dataset from the Stata system directory. In the next two lines, I will show how to export summary statistics and a scatter graph.
* Load the auto dataset
sysuse auto, clear

* Make and export a scatter graph
asdocx scatter mpg price

* Send summary statistics of all variables to the same document
asdocx sum
It is important to note that in the previous example, we simply added asdocx with the scatter mpg price command. This single line not only generated the scatter graph, but also exported it to the current document. All the options that are available with the graph/scatter/line/twoway commands can be utilized to customize the graph to a desired format. The resulting document appears as follows.

 Graph Height and Width
When exporting graph to a Word documents, users can now use options width() and height() to control the width and height of the graph. For a high resolution graph, the width and height values can be set as high as desired.
sysuse auto, clear
asdocx scatter rep78 price, width(2000) height(3000)
 Community Contributed Graphs
asdocx allows exporting graphs from several community-contributed packages (available on the SSC). Supported packages include the following:
- calibrationbelt
- coefplot
- dstat
- floatplot
- heatplot
- hexplot
- multidensity
- reldist graph
- riocplot
- tabplot
- vc_graph
Graph Example
