
Tabulations
As with other Stata commands, you only need to add asdocx as a prefix to the tabulation commands, including tabulate, tab1, and tab2, etc. You can use the following options of asdocx to control its behavior. (1) replace / append (2) save(filename) (3) title(text) (4) fs(#).
One-way table
asdocx generally follows the syntax structure and options of the official tab command, but also provide an additional nocf option to suppress the cumulative frequencies column of the tab command.
Example: Base case
sysuse auto, clear
asdocx tabulate rep78, replace
| Repair Record 1978 | Freq. | Percent | Cumulative Freq. |
|---|---|---|---|
| 1 | 2 | 2.90 | 2.90 |
| 2 | 8 | 11.59 | 14.49 |
| 3 | 30 | 43.48 | 57.97 |
| 4 | 18 | 26.09 | 84.06 |
| 5 | 11 | 15.94 | 100.00 |
| Total | 69 | 100.00 | |
| Notes: | |||
Please note that replace is asdocx option to replace the existing file. If we were to write to the existing file, we would then use option append, instead of replace.
No cumulative frequencies
asdocx tabulate rep78, replace nocf
| Repair Record 1978 | Freq. | Percent |
|---|---|---|
| 1 | 2 | 2.90 |
| 2 | 8 | 11.59 |
| 3 | 30 | 43.48 |
| 4 | 18 | 26.09 |
| 5 | 11 | 15.94 |
| Total | 69 | 100.00 |
| Notes: | ||
Two-way table of frequencies
The official tabulate produces a two-way table of frequency counts, along with various measures of association. To export its output with asdocx:
webuse citytemp2, clear
asdocx tab region agecat, replace
| Census Region | agecat | |||||
|---|---|---|---|---|---|---|
| 19-29 | 30-34 | 35+ | Total | |||
| NE | 46 | 83 | 37 | 166 | ||
| N Cntrl | 162 | 92 | 30 | 284 | ||
| South | 139 | 68 | 43 | 250 | ||
| West | 160 | 73 | 23 | 256 | ||
| Total | 507 | 316 | 133 | 956 | ||
| Notes: | ||||||
Include row percentages
Option row displays the relative frequency of each cell within its row in a two-way table.
asdocx tabulate region agecat , row replace
| Age category | ||||
|---|---|---|---|---|
| Census region | 19–29 | 30–34 | 35+ | Total |
| NE | 46 | 83 | 37 | 166 |
| 27.711 | 50 | 22.289 | 100 | |
| N Cntrl | 162 | 92 | 30 | 284 |
| 57.042 | 32.394 | 10.563 | 100 | |
| South | 139 | 68 | 43 | 250 |
| 55.6 | 27.2 | 17.2 | 100 | |
| West | 160 | 73 | 23 | 256 |
| 62.5 | 28.516 | 8.984 | 100 | |
| Total | 507 | 316 | 133 | 956 |
| 53.033 | 33.054 | 13.912 | 100 | |
| Notes: First row has frequencies, and second row has row percentages. | ||||
Include column percentages
Option column displays the relative frequency of each cell within its column in a two-way table.
asdocx tabulate region agecat , column replace
| agecat | ||||
|---|---|---|---|---|
| Census Region | 19-29 | 30-34 | 35+ | Total |
| NE | 46 | 83 | 37 | 166 |
| 9.073 | 26.266 | 27.82 | 17.364 | |
| N Cntrl | 162 | 92 | 30 | 284 |
| 31.953 | 29.114 | 22.556 | 29.707 | |
| South | 139 | 68 | 43 | 250 |
| 27.416 | 21.519 | 32.331 | 26.151 | |
| West | 160 | 73 | 23 | 256 |
| 31.558 | 23.101 | 17.293 | 26.778 | |
| Total | 507 | 316 | 133 | 956 |
| 100 | 100 | 100 | 100 | |
| Notes: First row has frequencies, and second row has column percentages. | ||||
One- and two-way tables of summary statistics
The option summarize() produces one- and two-way tables (breakdowns) of means and standard deviations.
sysuse auto, clear
asdocx tabulate rep78, summarize(mpg) replace
| Repair record 1978 | Mean | St.Dev | Frequency |
|---|---|---|---|
| 1 | 21 | 4.243 | 2 |
| 2 | 19.125 | 3.758 | 8 |
| 3 | 19.433 | 4.141 | 30 |
| 4 | 21.667 | 4.935 | 18 |
| 5 | 27.364 | 8.732 | 11 |
Two variables tabulation with summary statistics
generate wgtcat = autocode(weight, 4, 1760, 4840)
asdocx tabulate wgtcat foreign, summarize(mpg) replace
Suppress frequencies
asdocx tabulate wgtcat foreign, summarize(mpg) nofreq replace
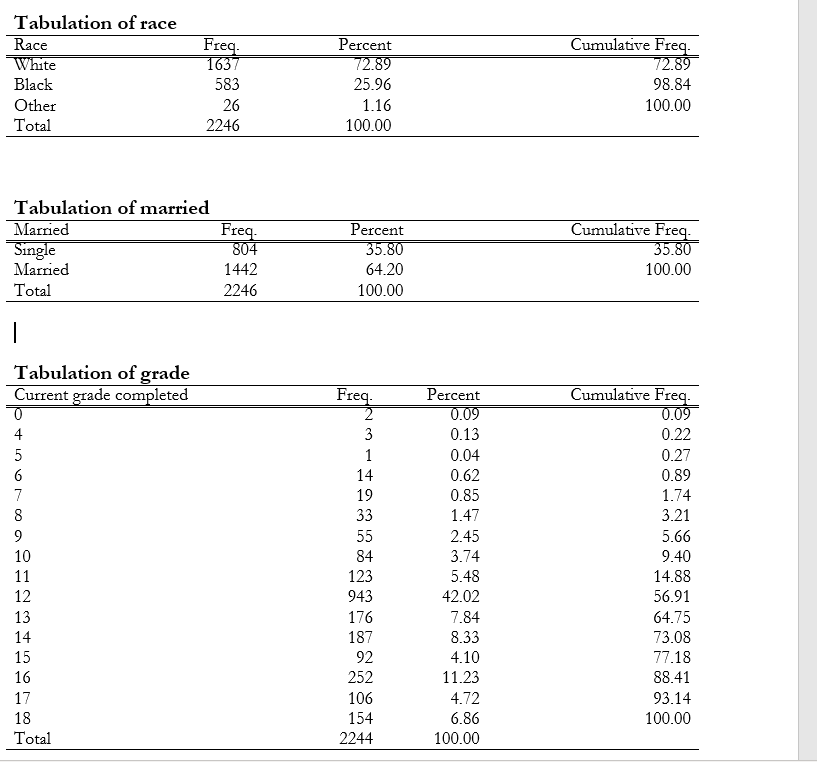
Multiple-way tabulation (tab1)
tab1 produces a one-way tabulation for each variable specified in varlist.
sysuse nlsw88, clear
asdocx tab1 race married grade, replace
Two-way for all possible combinations (tab2)
asdocx tab2 race south, replace