
Forum Replies Created
-
AuthorPosts
-
Dear Will Hall
This might happen if you have the Excel open. If that is the case, additional contents cannot be written to an open file. I am using the following three coding lines and their contents are reflected in the Excel file
asdocx sum, save(myfile.xlsx) replace
asdocx cor
asdocx reg price mpg rep78 headroom trunk
Hello Pro Bijaya Kumar
You are right. Thetemplate(table1)works only when the treatment variable is binary or has two categories. This is because the template was designed to meet the requirement of a professor who wanted to pay for the development of such template. You are welcome to support further development of this template.Hello Prof. Bijaya Kumar
Yes, nested regression tables can be created for all regression commands. See this examplewebuse lbw asdocx logistic low age lwt i.race smoke ptl ht ui, replace nest asdocx logistic low age lwt i.race ptl ht ui, nest asdocx logistic low age lwt i.race smoke , nest Table: Regression results 0 |1 2 3 4 ----+----------------------------------------------------------------------------- 1 | (1) (2) (3) 2 | low low low ----+----------------------------------------------------------------------------- 3 |age -0.027 -0.032 -0.023 4 | (0.036) (0.035) (0.034) 5 |lwt -0.015** -0.017** -0.013* 6 | (0.007) (0.007) (0.006) 7 |1bn.race 8 | 9 |2.race 1.263** 1.042** 1.231** 10 | (0.526) (0.508) (0.517) 11 |3.race 0.862** 0.41 0.944** 12 | (0.439) (0.38) (0.416) 13 |smoke 0.923** 1.054*** 14 | (0.401) (0.38) 15 |ptl 0.542 0.679** 16 | (0.346) (0.341) 17 |ht 1.833*** 1.896*** 18 | (0.692) (0.709) 19 |ui 0.759* 0.767* 20 | (0.459) (0.446) 21 |_cons 0.461 1.308 0.33 22 | (1.205) (1.15) (1.108) 23 |Observations 189 189 189 24 |Pseudo R2 0.142 0.118 0.086 ----------------------------------------------------------------------------------in reply to: Table gridlines #16153Hello Brian
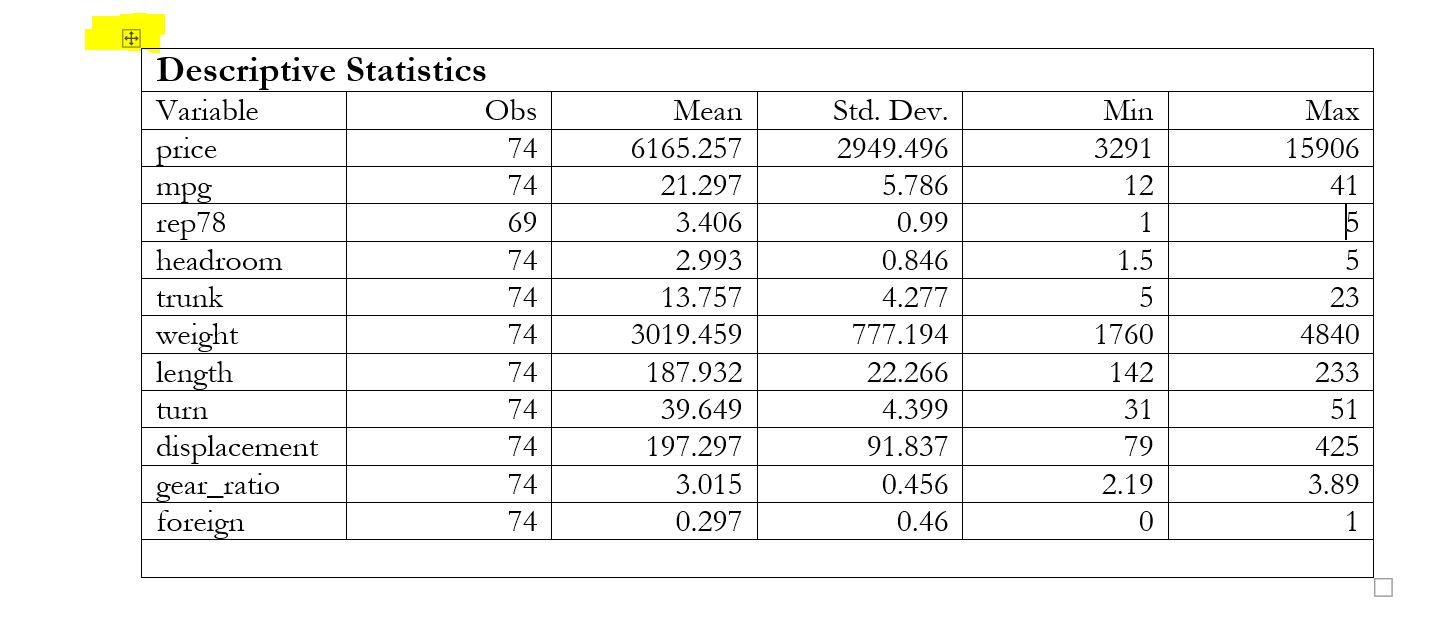
asdocx creates regular tables in MS Word. There is nothing peculiar about the way asdocx creates these tables. If you want to see how the table looks like with all borders visible, you may click on the table handle (as shown below with yellow color) inside Word, theTable Designtab will appear. Under theBordersgroup, click on borders and selectall borders.
As shown in the following picture, asdocx table has one merged row for table title at the top of the table, and one merged row for tables notes at the bottom of the table. Rest of the table can be viewed and modified as desired.
 in reply to: Suppress R-square but report Adj-R2 #16147
Hello Brian
I have updated asdocx in line with your request. R-squared can now be optionally suppressed in nested tables. The adjusted r-squared can be shown with the option stat(r2_a). See this example:asdocx_update sysuse auto asdocx reg price mpg rep78 , nest stat(r2_a) nor2 replace asdocx reg price mpg rep78 trunk, nest stat(r2_a) nor2 Table: Regression results 0 |1 2 3 ----+----------------------------------------------------------------------------- 1 | (1) (2) 2 | price price ----+----------------------------------------------------------------------------- 3 |mpg -271.643*** -252.266*** 4 | (57.771) (70.806) 5 |rep78 666.957* 650.053* 6 | (342.356) (346.176) 7 |trunk 42.466 8 | (88.662) 9 |_cons 9657.754*** 8711.347*** 10 | (1346.54) (2395.593) 11 |Observations 69 69 12 |Adj R\super2 0.228 0.219 ----------------------------------------------------------------------------------in reply to: Building table row by row not working in asdocx #16142All commands related to
row()are deprecated in asdocx. They are replaced with the flexmat suit of commands. flexmat is part of asdocx package, and is already installed on your system. See resources related to flexmat here.Video : https://www.youtube.com/watch?v=HzTlpMF4dZI
Post: Introduction to flexmat:
Using flexmat inside asdocxThe example you have quoted above can be easily implemented using flexmat.
flexmat reset
flexmat addrow, data(\i, \i, invest, \i, \i, kstock,\i) row(1) col(1)
flexmat addrow, data( Periods, N, Mean, SD, N, Mean, SD) row(2) col(1)

webuse grunfeld, clear
sum invest if inrange(year , 1935, 1945)
flexmat addrow, data(1935-1945, r(N)' ,r(mean)', `r(sd)') row(3) col(1) dec(3)

sum kstock if inrange(year , 1935, 1945)
flexmat addrow, data(`r(N)' ,r(mean)', `r(sd)') row(3) col(5) dec(3)

asdocx exportflex
Yes, the help needs to be updated.
in reply to: Export table from SEM command | asdocx | Stata #16134Hello Rune Lomholt
Adding additional features to asdocx requires time, and I have to prioritize features that many researchers will benefit from. I do accept contribution from user who might want to add some niche features to asdocx. Such contributions are acknowledged in the asdocx.ado’s main header.
Concerning the suggested commands, I would recommend using workarounds. (For reporting total effects, indirect effects and direct effects, please see this post https://asdocx.com/table-of-direct-indirect-and-total-effects-after-sem-word-excel-latex-stata/). For example, you can use thewmatcommand of asdocx for theegcofas it leaves behind a matrix.use https://www.stata-press.com/data/r16/sem_2fmm sem (Affective -> a1 a2 a3 a4 a5) (Cognitive -> c1 c2 c3 c4 c5) estat eqgof mat a = r(eqfit) asdocx wmat, mat(a) replace Results Table 0 |1 2 3 4 5 6 ----+----------------------------------------------------------------------------- 1 | fitted predicted residual _cons _cons ----+----------------------------------------------------------------------------- 2 |a1 2028.598 1644.463 384.136 0.811 0.9 3 |a2 1923.217 1565.865 357.352 0.814 0.902 4 |a3 1307.726 1152.775 154.951 0.882 0.939 5 |a4 2024.798 1528.339 496.459 0.755 0.869 6 |a5 2052.328 1860.643 191.686 0.907 0.952 7 |c1 627.599 455.935 171.664 0.726 0.852 8 |c2 738.333 566.527 171.806 0.767 0.876 9 |c3 1082.374 806.36 276.014 0.745 0.863 10 |c4 851.311 627.112 224.199 0.737 0.858 11 |c5 725.3 578.435 146.866 0.798 0.893 -----------------------------------------------------------------------------------
in reply to: Nested regression suddenly not working #16128Sorry i I forgot to update the ado file, just updated it. Please update asdocx and see if the problem is solved?
in reply to: Nested regression suddenly not working #16122Please update asdocx and see if the problem is solved?
asdocx_update
in reply to: Tabulate without reporting row/column percent #16007You are right. Please update it now.
Hello Aduba Joesph
This issue has been fixed, please update asdocxasdocx_update
Given your request, I have now updated asdocx. When use option
labelin the nested regressions, asdocx will report variable labels for the dependent and independent variables.asdocx_update sysuse auto, clear asdocx reg rep78 price mpg, nest label replace asdocx reg foreign price mpg, nest label 0 |1 2 3 ----+-------------------------------------------------------------------------------------- 1 | (1) (2) 2 | Repair record 1978 Car origin ----+-------------------------------------------------------------------------------------- 3 |Price 0.000* 0.00** 4 | (0.00) (0.00) 5 |Mileage (mpg) 0.086*** 0.042*** 6 | (0.021) (0.009) 7 |constant 1.066* -0.893*** 8 | (0.614) (0.277) 9 |Observations 69 74 10 |R-squared 0.207 0.224 -----------------------------------------------------------------------------------
in reply to: Tabulate without reporting row/column percent #15995@Rune Lomholt
If you want to report just the percentages, you can use thenofreqoptionasdocx tab rep78 foreign , rowsort nofreq replace Tabulation of rep78 foreign 0 |1 2 3 4 ----+----------------------------------------------------------------------------- 1 | Repair record 1978 Car origin ----+----------------------------------------------------------------------------- 2 | 1 Domestic Foreign Total 3 |3 90 10 100 4 |4 50 50 100 5 |5 18.182 81.818 100 6 |2 100 0 100 7 |1 100 0 100 8 | Total 69.565 30.435 100 ----------------------------------------------------------------------------------in reply to: Tabulate without reporting row/column percent #15993Turns out that
rowsortandcolsortoptions in Stata generate frequencies, without percentages. To make the asdocx output at par with that of the Stata’s output, I have now made some changes to asdocx. Therefore, these options no longer generate percentages. See the following exampleasdocx_update sysuse auto, clear * using rowsort and colsort options asdocx tab rep78 foreign , rowsort colsort replace Tabulation of rep78 foreign 0 |1 2 3 4 ----+----------------------------------------------------------------------------- 1 | Repair Record 1978 Car type ----+----------------------------------------------------------------------------- 2 | 1 Domestic Foreign Total 3 |3 27 3 30 4 |4 9 9 18 5 |5 2 9 11 6 |2 8 0 8 7 |1 2 0 2 8 | Total 48 21 69 ----------------------------------------------------------------------------------in reply to: Tabulate without reporting row/column percent #15987You can get rid of any column or row using the capability of flexmat. See this example
* First create the full table
asdocx tab rep78 foreign, rowsort colsort replace
                                Tabulation  of rep78 foreign
  0 |1                                          2             3            4
----+-----------------------------------------------------------------------------
  1 |  Repair record 1978              Car origin
----+-----------------------------------------------------------------------------
  2 | 1                                  Domestic       Foreign        Total
  3 |3                                         27             3           30
  4 |                                          90            10          100
  5 |                                       56.25        14.286       43.478
  6 |4                                          9             9           18
  7 |                                          50            50          100
  8 |                                       18.75        42.857       26.087
  9 |5                                          2             9           11
 10 |                                      18.182        81.818          100
 11 |                                       4.167        42.857       15.942
 12 |2                                          8             0            8
 13 |                                         100             0          100
 14 |                                      16.667             0       11.594
 15 |1                                          2             0            2
 16 |                                         100             0          100
 17 |                                       4.167             0        2.899
 18 | Total                                    48            21           69
 19 |                                      69.565        30.435          100
 20 |                                         100           100          100
----------------------------------------------------------------------------------
Click to Open File:  C:\temp\MyFile.docx

* The flexmat table shows rows and columns numbers for easy identification
** drop the desired rows
. flexmat droprow, row(4,5,7,8,10,11,13,14,16,17,19,20)


                            Tabulation of rep78 foreign
  0 |1                                                             2                 3                     4
----+-------------------------------------------------------------------------------------------------------
  1 |       Repair ~1978                    Car origin
----+-------------------------------------------------------------------------------------------------------
  2 |                                                       Domestic           Foreign                 Total
  3 |3                                                            27                 3                    30
  4 |4                                                             9                 9                    18
  5 |5                                                             2                 9                    11
  6 |2                                                             8                 0                     8
  7 |1                                                             2                 0                     2
  8 |       Total                                                 48                21                    69
------------------------------------------------------------------------------------------------------------

* Now export the results
. asdocx export
-
AuthorPosts