Ever wanted to create high-quality summary statistics with one click in Stata. asdoc creates excellent tables of summary statistics such as mean, standard deviation, minimum, maximum, etc. asdoc offers four different methods of creating tables of summary statistics. These are discussed below with examples and relevant options. To know about installation of the program and other feature, you can visit this blog post.
The default tables of summary statistics
In Stata, the summarize or sum command is typically used to generate a table of summary statistics. For instance, if you’re working with the auto dataset, you would type:
[code]sysuse auto
sum
[/code]To export the output from the sum command to a Word document, you can use the asdoc command. The asdoc command sends Stata output to Word documents. Here’s how you can do it:
[code]sysuse auto
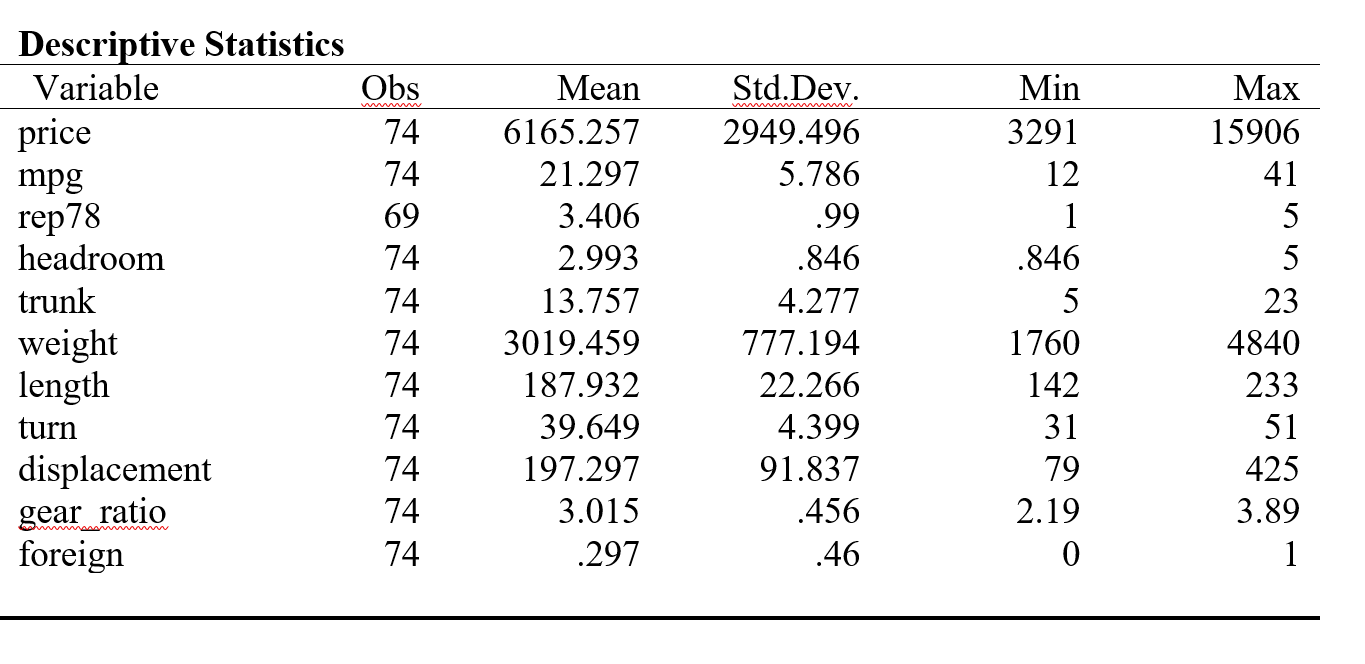
asdoc sum[/code]
After running these commands, a Word document will be created in your current directory with the summary statistics of all variables in the auto dataset, and appreciate the generated table.
More options
[code]asdoc sum price mpg rep78 headroom trunk[/code]
Summary / descriptive statistics with [if] [in] conditions
[code]asdoc sum price mpg rep78 headroom trunk if price>4000[/code]
Control decimal points with the option dec()
[code]asdoc sum, dec(2)[/code]
Explore asdocx
While asdoc is a powerful tool for exporting Stata output to Word documents, asdocx takes it a step further. asdocx is an even more powerful tool that offers greater customization and the ability to create Word, Excel, LaTeX, or HTML documents.
With asdocx, you can control the formatting of tables and text, apply custom styles, and even generate high-quality graphs. This makes it an excellent choice for creating professional reports and presentations directly from your Stata output. To know more about asdocx, visit the asdocx website.
Your support keeps these efforts alive