 Stata Code for Rank and Sign Momentum Strategies
Our Stata code for rank and sign momentum strategies follow the work of Tsung-Yu Chen, Pin-Huang Chou, Kuan-Cheng Ko, S. Ghon Rhee (2021) who presented evidence that momentum strategies built on the rank and sign of daily returns generate significant profits for short-term holding periods and exhibit no long-term return reversals. More importantly, they subsume traditional price momentum, but not vice versa. Chen et al. (2021) use non-parametric measures based on ranks and signs. Let R_{i,d} denote stock i‘s daily return on day d, N_d denote the number of stocks on day d, and y(R_{i,d}) as the rank of R_{i,d} among N_{d} stocks on day d, in ascending order. The standardized rank for each trading day is expressed as follows (Wright, 2000):
The daily ranks are averaged every month and then averaged over the p-month formation period, which gives a firm’s average rank, rank_{i,t}(p).
Chen et al. (2021) also use calculate an alternative non-parametric measure based on signs. The sign measure is an indicator function that takes the value of 1 if stock i’s corresponding daily return R_{i,d} is positive, and 0 otherwise. They sort stocks into ten deciles based on their average ranks and construct a rank momentum (RM) strategy. An SMstrategy is likewise evaluated using the average sign measure. The long-short portfolio is held for one month, six months, 12 months, one year, two years, and three years.
 Accuracy of the Code
We have rigorously tested the code with both real and dummy data, and it consistently produces the expected results, accurately matching the benchmarks created during the construction of the dummy data.
 Pricing
The code for sign and rank momentum strategies is available for $ 198. If you are interested in the estimation of the Jagadish and Titman type momentum strategies, you can add $79 to the above. For further details and inquiries, please don’t hesitate to contact us at the following:

attaullah.shah@imsciences.edu.pk
Stata.Professor@gmail.com
 What is included in the package
The package you shall receive includes:
- Stata code for rank and sign momentum
- Code comments inside the
.dofile - Sample dataset to run the code
The code:
- Uses daily stock returns data and applies certain data filters, such as removing outliers.
- Finds 1-month, 6-month, and 12-month momentum based on ranks.
- Creates momentum portfolios and determines their monthly returns.
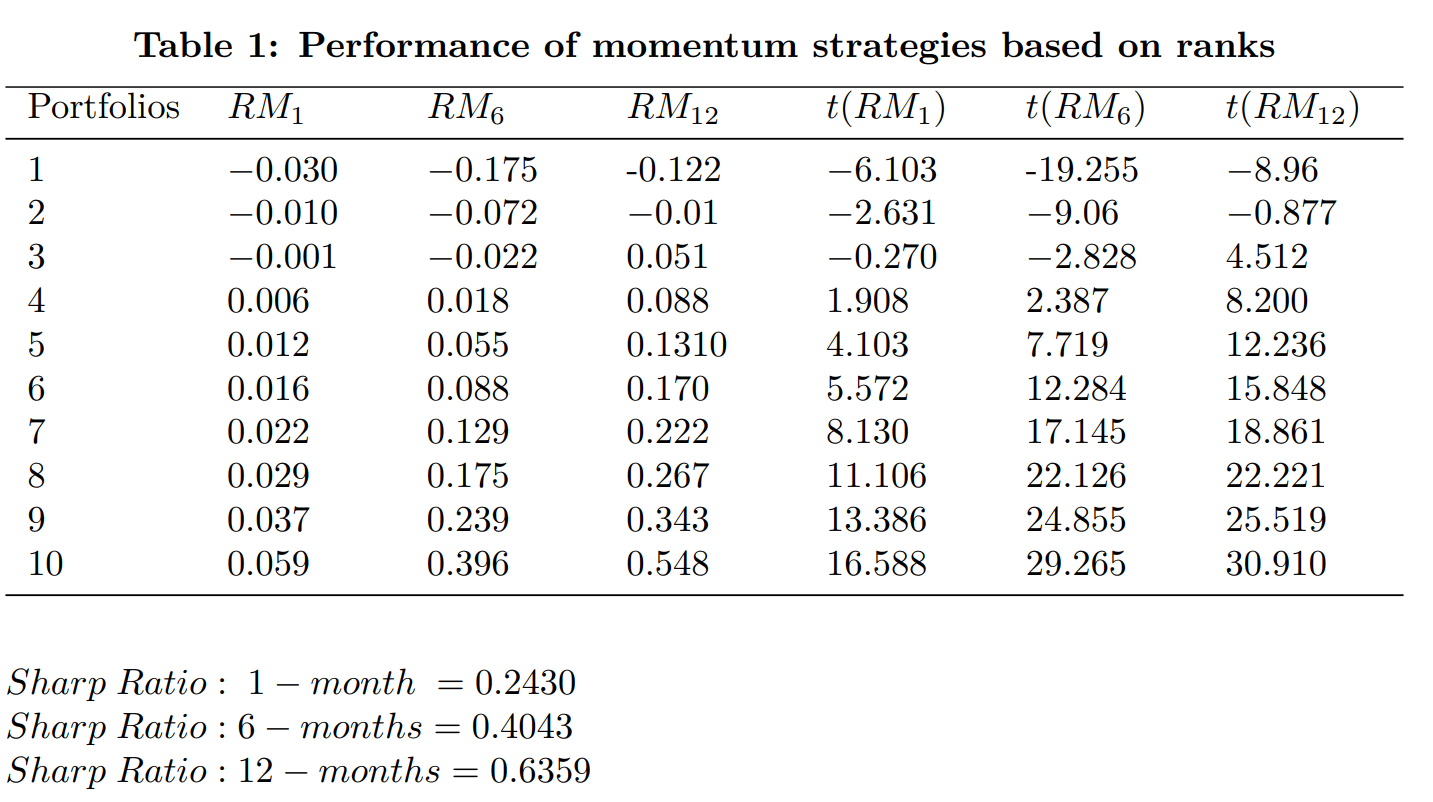
- Generates a table of mean returns and their t-values for each portfolio.
- Calculates the Sharpe ratios.
A sample table output for rank-based momentum is provided below. The code also generates a similar table for sign-based momentum strategies.


reasons to buy the code?


 References
Chen, T. Y., Chou, P. H., Ko, K. C., & Rhee, S. G. (2021). Non-parametric momentum based on ranks and signs. Journal of Empirical Finance, 60, 94-109.
Wright, J. H. (2000). Alternative variance-ratio tests using ranks and signs. Journal of Business & Economic Statistics, 18(1), 1-9.
Project code: P69
Other momentum strategies
Currently, we have codes for the following momentum strategies:

