
Osama Mahmood has asked :
If I want to report 25th and 75th percentiles for variables through asdoc, then how would I do that? And what if I do not want to report the Min and Max?
Answer: In this YouTube video, I have shown various methods in which descriptive statistics can be reported using asdoc. What Osama has asked for is possible with the customized descriptive statistics using the stat() option of asdoc. Using option stat(), we can choose from the following statistics. Each of the bold words in the following list represents the control word that can be used to report the required statistic.
N Number of observations
mean Arithmetic mean
sd Standard deviation
semean Stanard error of the mean
sum Sum / total
range Range
min The smallest value
max The largest value
count Counts the number of non-missing observations
var Variance
cv Coefficient of variation
skewness Skewness
kurtosis Kurtosis
iqr Interquartile range
p1 1st percentile
p5 5th percentile
p10 10th percentile
p25 25th percentile
p50 Median or the 50 percentile
p75 75th percentile
p99 99th percentile
tstat t-statistics that the given variable == 0
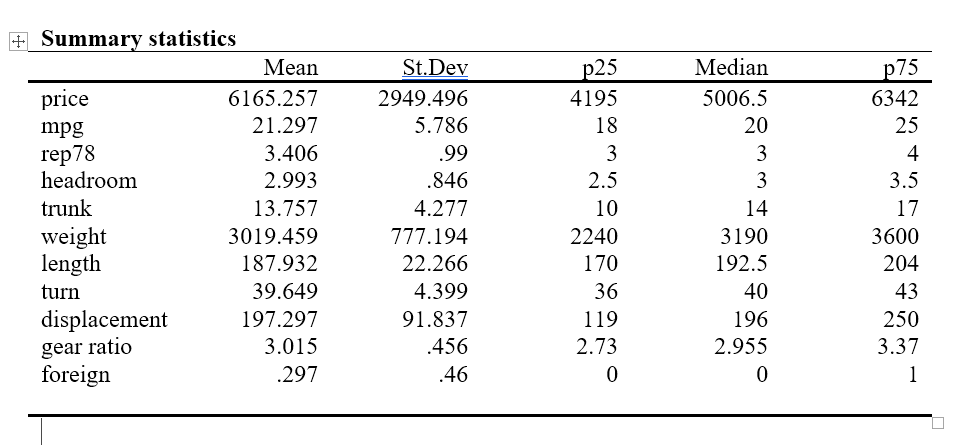
Example 1: Mean, sd, 25th percentile, median,
 sysuse auto
 asdoc sum, stat(mean sd p25 p50 p75) replace
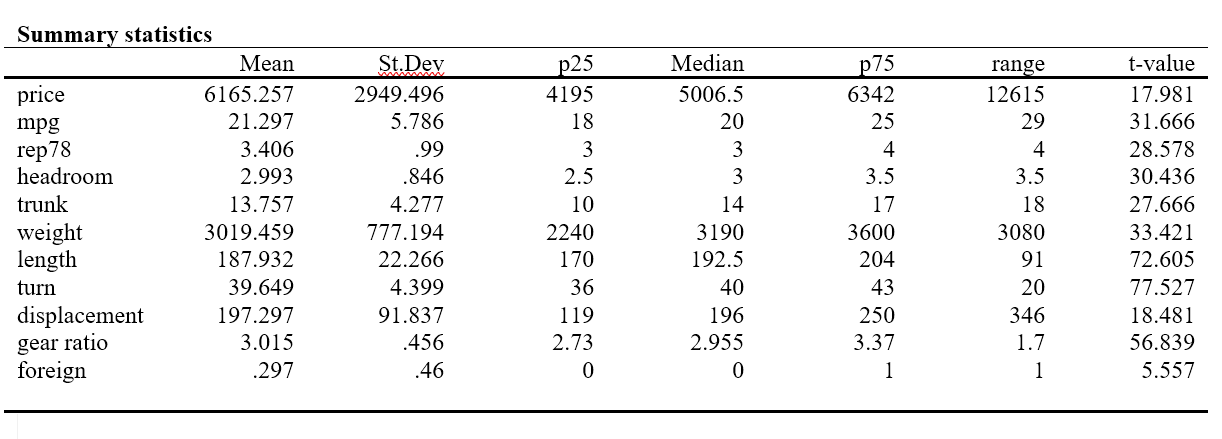
Example 2: Mean, sd, 25th percentile, median, and 75th percentiles, range, t-statistics
asdoc sum, stat(mean sd p25 p50 p75 range tstat) replace
Stata professor! Once again a great help. writing command on software is easy but most of us struggle to arrange those tables for documents. Your previous help on asdoc was also very useful. The way you have explained it is very easy to process and implement.
Thank you so much! I look forward to more such blogs and videos.
A nice contribution
asdoc provides a whole bunch of options to virtually send anything from Stata to MS word. I would say it is a big breakthrough for Stata users.
Very useful. I have shared with colleagues. Thanks.
Its a great help again , you people are just so amazing . a big thanks
Its really great sir
Great contribution, we are proud of you Prof. A.S