


For creating a high-quality publication-ready table of correlations from Stata output, we need to install asdoc program from SSC first.
ssc install asdoc, update
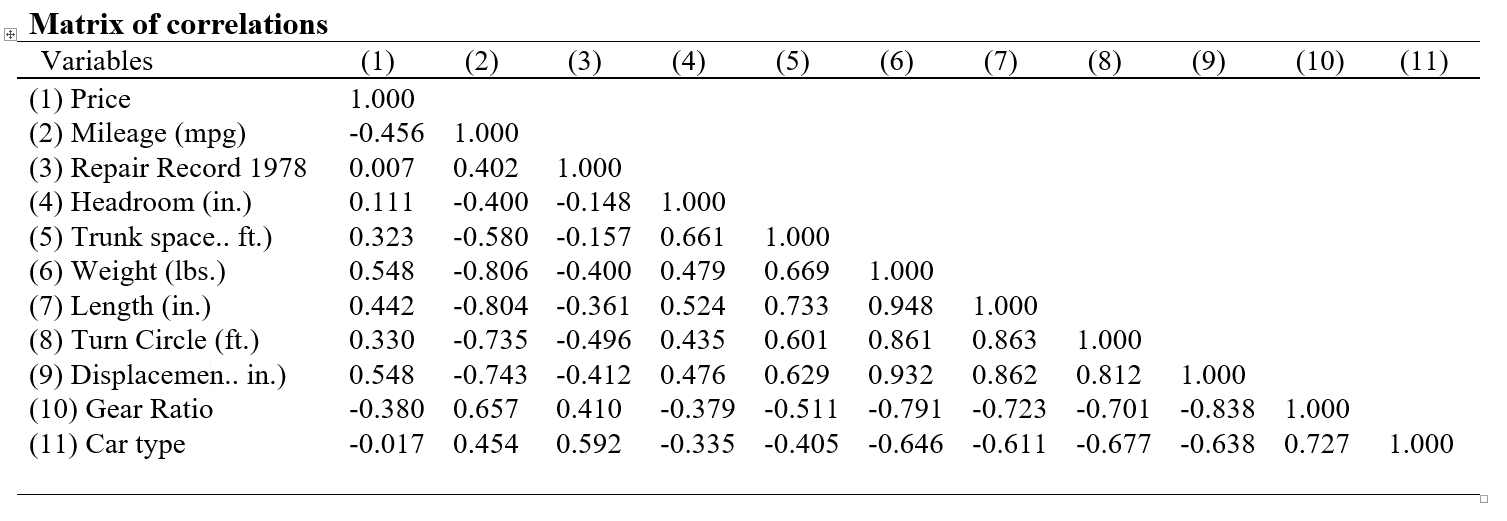
Once the installation is complete, we shall add the word asdoc to the cor command of Stata. Since we estimate correlations among all numeric variables of a dataset by typing cor in Stata, we shall add asdoc as a prefix to the cor command. Let us load the auto.dta data from the Stata example files.
Example 1: Make a table of correlation for all variables.
sysuse auto, clear
asdoc cor

Example 2: We can report variable labels instead of variable names
asdoc cor, label replace
Further, it is possible to write names of the variables in the column headings instead of sequential numbers. For this, we shall invoke the option nonum. Therefore, see example 3.
Example 3: Write variable names in column headers
sysuse auto, clear

asdoc pwcorr, nonum replace


Read also :
Generate a correlation table with significance/stars
Generate a table of descriptive statistics
Generate a table of customized descriptive statistics
Hello,
Is it possible to added star (0.01 0.05 0.10) respectively to asdoc cor?
This is possible with
pwcorrcommand. Use thesetstars()option. The default significance levels for reporting stars are set at : *** for p-values <=0.01; ** for p-values <=0 .05, and * for p-values <=0.1. However, now we can set our own levels for statistical significance using option setstars. An example of setstars option looks like:As we can see from the above line, setstars separates each argument by a comma. Each argument has three components. The first component is the symbol (in our case it is *) which will be reported for the given significance elve. The second component is the @ sign that connects the significance level with the symbol. And the third component is the value at which the significance level is set. So if we want to report stars such that
We shall write the option setstars as
This does not work for me .I have stata 16.1 and installed the newest version of asdoc. I used the pwcorr command
When you say “it does not work for me”, is not helpful to understand the issue. Remember to provide information on:
1. What did you type in Stata
2. What error message / unexpected output you got from there?
Hi,
I use Stata 15.0
and I type the command like this
asdoc pwcorr TobinQ FirmSize FirmLeverage ROA, star(all) save(D:\202106_DataAnalysis\202106_Table_Results\202106_6_pwcorr.doc) label replace setstars(*@.05, **@.01, ***@.001) nonum
I hope to see the note under the correlation table as *** p<0.001, ** p<0.01, * p<0.05
but it show like *** p<0.01, ** p<0.05, * p<0.1
setstar is work when I run the regression but not for pwcorr
Hope you can guide me on how to do it
Thanks in advance
This is possible in asdocx, which has a dozen more powerful features. See details here
https://fintechprofessor.com/asdocx/
Does this mean that the stars to indicate significance are not possible for other correlation methods, such as Spearman?
Yes, you are right.
Dr. Shah,
Is there a way to bold the correlation result with the one they are significant at 5% below?
If we have many variables and they can not fit in one table, is there a way to break the correlation results into two panels (one on the top and another on the bottom).
Thank you.
HP
Hello, I try to do correlation by groups? I try but it does not work
bys country: asdoc corr x y z
Hi,
There seems to be an error with stars when I use wide. It will only show *** for all p-value <=0.05 and * for all p-value <= 0.1. The **, when p-value is between 0.01 and 0.05 has been missing. This problem happens whenever I use wide, and it remains even after I use setstars. Could you help solve this? Thanks!
Hello Jino
Please post a reproducible example with code.
Hi Attaullah,
your program sounds like a real lifesaver. Unfortunately I am getting two errors when I try the asdoc pwcorr command.
asdoc pwcorr veganchoice healthlabel environmentlabel envXhealth age female frequency education income , star(all)
             | veganc~e health~l enviro~l envXhe~h      age   female freque~y educat~n   income
-------------+---------------------------------------------------------------------------------
 veganchoice |   1.0000
 healthlabel |   0.1106*  1.0000
environmen~l |   0.1131*  0.1662**  1.0000
  envXhealth |   0.1659**  0.6211***  0.6393***  1.0000
         age |  -0.1512** -0.0850  -0.0069  -0.0801   1.0000
      female |   0.0935   0.0000  -0.0817  -0.0451  -0.1160*  1.0000
   frequency |  -0.6122*** -0.0325  -0.1082  -0.0551   0.0236  -0.1938***  1.0000
   education |   0.0947   0.0454   0.0503   0.0353  -0.1491** -0.0136  -0.1944***  1.0000
      income |  -0.0902  -0.0053  -0.0166   0.0158   0.1198* -0.1292*  0.1205*  0.0787   1.0000


  rtf_maker():  3499  delete_closing_lines() not found
                 :     -  function returned error
I am sorry if this looks messy. I just wanted to show the command I am using and the output/error message.
Is this an error on my end? I have tried to use the commands you suggested.
Please advise on how to fix the issue.
regards
Please try the new version of asdoc, that can be installed from my site. Copy and paste the following line in Stata and press enter.
net install asdoc, from(http://fintechprofessor.com) replace
Please note that the above line has to be copied in full. After installation of the new version, then restart Stata. If the problem persists, then send a dummy data and your code to reproduce the error at my end.
asdocx is now available
A more powerful and flexible version of asdoc is now available. I call it asdocx. You may like to check the details here
https://fintechprofessor.com/asdocx
Please do remember to cite asdoc. To cite:
In-text citation
Tables were created using asdoc, a Stata program written by Shah (2018).
Bibliography
Shah, A. (2018). ASDOC: Stata module to create high-quality tables in MS Word from Stata output. Statistical Software Components S458466, Boston College Department of Economics.
hi, I typed asdoc pwcorr Tobinq ROA WoB Blau Shannon Women1 Women2 Women3… with 17 variables. how can i rotate the table in word? because the table is too large.
Table rotation is possible in asdocx, not in asdoc. asdocx offers dozen other useful features, see details here https://fintechprofessor.com/asdocx/