

Introduction
Option row is a new feature in version 2.0 of asdoc. This feature allows building tables in pieces. That is good news for those who want to make highly customized tables from Stata output.
This feature can be considered an advanced topic and might not be good for Stata beginners. With many other Stata commands, using asdoc is exceptionally easy. You can read this concise blog post for some basic examples of using asdoc. However, if you are already familiar with Stata macros and results returned in r() and e() macros, then you should continue reading this post.
How does option row work?
Option row allows building a table row by row from text and statistics. In each run of asdoc with option row, a row is added to the output table. The syntax for using this option is given below:
asdoc, row(data1, data2, data3, ...)
As shown above, we shall type nothing after the word asdoc. Therefore, all other arguments of the command come after the comma. The first required option is row(data1, data2, …). Here data1, data2, … can be either a numeric value, string, or both. Within the brackets after option row, each piece of data should be separated by the character comma and hence it will be written to a separate cell in the output table. If a cell is empty, then each comma should be accompanied by a backslash that is ",\"
Options
We can use the following options when using option row. dec(): for specifying the number of decimal points. If not used, the default is to use three decimal points. An example of using this option could be dec(2) for using two decimal points. title() : This will add a title to the table. This option works only when the row option is used for the first time in the creation of a table. For example, title(Descriptive Statistics). replace: this option will replace any existing file. Without option replace, the default is to append results.
save(): This will save file with the specified name. For example, save(Table 1) will save the file with the name Table 1.
A simple example
To understand how does the option row work, let us write first the table column title and then some data. Let us create a table that has four columns. The columns are named as KP, Sindh, Baluchistan, and Punjab. We shall write the table title as Provincial GDP of Pakistan. So the first row is the header row
asdoc, row(Years, KP, Sindh, Baluchistan, Punjab) title(Provincial GDP of Pakistan over years) replace
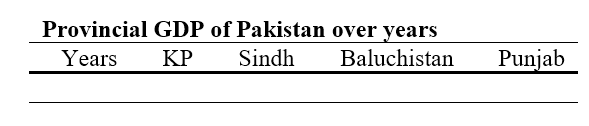
The above line of code generates the table title and the header row. Please note that we also included Years in the table columns because we shall report the provincial GDP over years, therefore we need one additional column for displaying the year labels in the first column. Now let us continue writing to this table. Make sure that you close the Word file before writing additional rows to it.
asdoc, row(1999, 2500.55, 4000.35, 1000.21, 5500.74) dec(2)
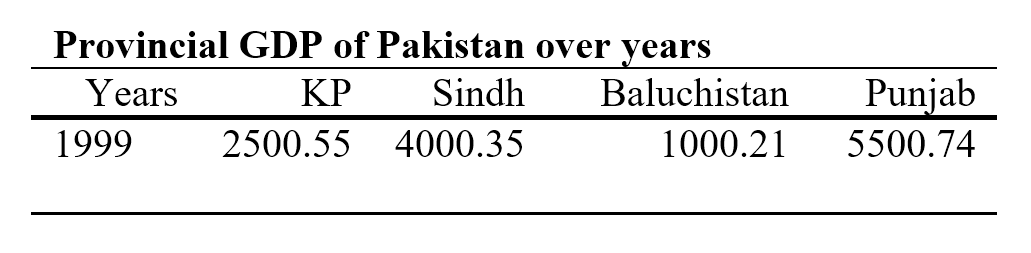 In the second line of code, we did not write replace as we wanted to append the results to the same file "MyFile.doc" and we also skipped the title option. We used option dec(2) to report two decimal points with numeric values. We can continue writing additional rows to this table.
asdoc, row(200, 2600.25, 4500.35, 1100, 5700.87) dec(2)

Collecting stats with option accum
We can create a table from text and statistics that are collected from different Stata commands. There is one challenge to developing such a flexible table with option row – that a given row has to be written in one go. So once a row is written, no further cells can be appended to the same row. This means that we need to first collect all the required bits of information before writing a row. Collecting and holding these bits of information can be tricky or too time-consuming. To facilitate this process, asdoc offers option accum(data1 data2,…). The word accum is an abbreviation that I use for accumulate. The syntax of this option is given below:
asdoc, accum(data1 data2 data3 data4 data5 ...) [ dec(#) show ]
Actually, the above command can be run as long as the limit of the global macro to hold data is not reached. The above command will accumulate text and statistics from different runs of asdoc and hold them in the global macro $. Once we have accumulated all the needed bits of information in the global macro, then its contents can be written to the Word table with option row. Option show can be used to show the contents of the global macro $. Assume that we want to build an odd table that presents the number of observations, mean, and standard deviation for two variables in two different time periods. The researcher wants to follow the following format: 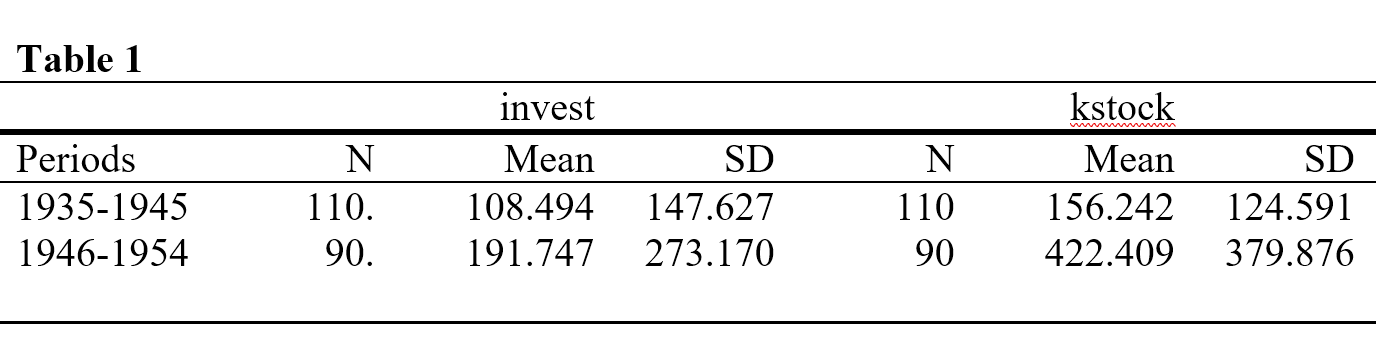
webuse grunfeld, clear

asdoc, row( \i, \i, invest, \i, \i, kstock,\i) replace

asdoc, row( Periods, N, Mean, SD, N, Mean, SD)

sum invest if inrange(year , 1935, 1945)

asdoc, accum(`r(N)', `r(mean)', `r(sd)')

sum kstock if inrange(year , 1935, 1945)

asdoc, accum(`r(N)', `r(mean)', `r(sd)')

asdoc, row( 1935-1945, $accum)
Explanation:
1. The second row of our required table reveals that a total of 7 cells are needed, this is why we created 7 cells in the first line of code. The text " \i," is a way of entering an empty cell. We entered empty cells so that the variables names invest and kstocks are written in the middle of the table.
2. The second line of code writes the table header row.
3. The third line finds summary statistics. We shall collect our required statistics from the macros that are left behind in r() by the sum command.
4. The fourth line accumulates the required statistics for our first variable invest
5. We are not yet writing the accumulated statistics to the Word file. So we find statistics for our second variable kstocks in the fifth line.
6. We again accumulate the needed statistics for our second variable in the sixth line.
7. Since our row of required statistics is now complete, we write the accumulated statistics and the first-row label, i.e, 1935-1945 to our Word file. Let us write one more row to the table. This time, the statistics are based on years 1946-1954
sum invest if inrange(year , 1946, 1954)

asdoc, accum(`r(N)', `r(mean)', `r(sd)')

sum kstock if inrange(year , 1946, 1954)

asdoc, accum(`r(N)', `r(mean)', `r(sd)')

asdoc, row( 1946-1954, $accum)
Need more examples?
There was a question on Statalist for a customized table for reporting ttest results. Liu Qiang made an excellent use of the option row() of asdoc. See his solution here
I use this fantastic function in a foreach-loop. Is it possible to use variable labels in the row-function (eg. “`=`var'[1]'”) (instead of 1946-1954 in the example)?
Dear David, yes this is possible. You can first obtain the variable label with the macro extended function and then use the label. Consider the following example.
* Load the auto dataset
sysuse auto

* Find the mean of the variable price mpg and trunk and write their labels
sysuse auto, clear

asdoc, row( Variable, Lael, Mean) replace
* Start the loop

foreach v of varlist price mpg trunk {
   * get the variable label
   local mylabel : variable label `v'
   loc mylabel = subinstr("`mylabel'", ")", "]", .)
   sum `v'
   asdoc, row(`v', `mylabel', `r(mean)' ) btp
}
If you have noted, the subinstr() function replaces any closing parenthesis with bracket in the labels. This is necessary to avoid any confusion that the closing parenthesis can cause to the option row. The option btp then replaces the brackets back to parenthesis when the results are written to the word file.
Hello, Professor Sha,
I been trying to use asdoc with tabstat x1 x2 … xn, by(h) stat(mean sd). The table looks great in state output but when transferred to ms word via the asdoc command, the table was splited in groups. Meanwhile, I wanted the table as row(h), column (mean (sd) x1, x2, …, xn). the result is the same if when I used bysort: asdoc… What am doing wrong? or how do I get the result I am looking for? Thanks for you kind response.
I have been doing some tables using asdoc on Windows. However, when I tried the commands on macOS, I can open the output file but I can just see some messy lines, even if I move the file to Windows. I checked that this happens if I use row more than once. When I execute row one time I can see the table with one row but when I execute one more time, it gets absolutely messy. Do you know how I can some this? Thank you in advance.
Jose Lorenzo: I have not yet tested asdoc on MacOS. Thanks for your feedback, I shall check it out.
Jose Lrenzo:
I have modified asdoc package to add support for macOS. Can you please download it from my site by typing the following command and let me know of your comments and report if there is still any error in the package. Also, please note that I have made a small program to first completely remove previous installation. Once that is done, we can install the next version of asdoc.
So, please copy and paste the following three lines in Stata command window and press enter
Hi, wonderfull post. Could you help me how to use the same command for proportions? 2×2 tables?
Tiago NM: Can you please provide some details on what are you asking for? An example of the output table and some sample data set would be helpful. You can contact directly at attaullah.shah@imsciences.edu.pk
This is a really useful tool. I am trying to export a STATA dta file which contains my summary statistics I need for a table. I already created the table prior to coming across the asdoc function. Is there a way to export a .dta file into word with asdoc?
Seun E: I get this request so often that I wrote a separate post on it. The post can be accessed here.
Thank you! Just found the post. Can it work with collapse? I tried to use the asdoc with row function but I am not quite getting it right
Seun: Collapse can be used before using the asdoc list and then it will work.
I am trying to export out the average quarterly cost for patients with GI only and GI wi
asdoc, row( i\, \i, G.I only, \i, G.I with sequelae,\i) replace

asdoc, row(Period avg_cost, se_cost avg_cost, se_cost)

* Start the loop
local y GI GI_sequelae
foreach v of varlist avg_cost se_cost{
forvalues q =1/4{
   tabulate `v' if quarter ==`q'
   asdoc, row(`v', `r(mean)' ) btp
   tabulate `y' if quarter ==`q'
   asdoc, row(`y', `r(mean)' ) btp
   }
}
I can see it ran in the results window but no data is exported into the word document
Seun : I can see that you are trying to use r(mean) after the tabulate command. The tabulate command does not leave behind r(mean), rather you can use the sum command.
asdoc, row( i\, \i, G.I only, \i, G.I with sequelae,\i) replace

asdoc, row(Period avg_cost, se_cost avg_cost, se_cost)

* Start the loop
local y GI GI_sequelae
foreach v of varlist avg_cost se_cost{
forvalues q =1/4{
   sum `v' if quarter ==`q'
   asdoc, row(`v', `r(mean)' ) btp
   sum `y' if quarter ==`q'
   asdoc, row(`y', `r(mean)' ) btp
   }
}
If that does not solve your problem, then please send an example of your data at attaullah.shah@imsciences.edu.pk
Many thanks. This is very helpful.
For inserting spaces between two tables in the same document, can you suggest a solution? As an example, consider the following:
sysuse auto,clear asdoc, row(Dependent variable:domestic or foreign, Domestic mean/frequency, Domestic SD, Foreign mean/frequency, Foreign SD, t-test) title(Summary statistics) save(myfile) replace asdoc, row( Model independent variables, \i, \i, \i, \i, \i) append foreach var of varlist price mpg rep78 headroom trunk weight length turn{ qui sum `var' if foreign==0 local mf=`r(mean)'/`r(N)' asdoc, accum(`mf', `r(sd)') qui sum `var' if foreign==1 local mf=`r(mean)'/`r(N)' asdoc, accum(`mf', `r(sd)') ttest `var', by(foreign) local t=round(abs(`r(t)'),0.001) local t=substr("`t'",1,5) if `r(p)'<=0.01 { local star "***" } else if `r(p)'<=0.05{ local star "**" } else if `r(p)'<=0.1{ local star "*" } else { local star " " } local tstar `t'`star' asdoc, accum(`tstar') asdoc, row(`var', $accum) } asdoc, text(Table 2) set seed 112233 gen transmission = round(runiform()) asdoc, row(Dependent variable:Automatic or Manual, Automatic mean/frequency, Automatic SD, Manual mean/frequency, Manual SD, t-test) append asdoc, row( Model independent variables, \i, \i, \i, \i, \i) append foreach var of varlist price mpg rep78 headroom trunk weight length turn{ qui sum `var' if transmission==0 local mf=`r(mean)'/`r(N)' asdoc, accum(`mf', `r(sd)') qui sum `var' if transmission==1 local mf=`r(mean)'/`r(N)' asdoc, accum(`mf', `r(sd)') ttest `var', by(transmission) local t=round(abs(`r(t)'),0.001) local t=substr("`t'",1,5) if `r(p)'<=0.01 { local star "***" } else if `r(p)'<=0.05{ local star "**" } else if `r(p)'<=0.1{ local star "*" } else { local star " " } local tstar `t'`star' asdoc, accum(`tstar') asdoc, row(`var', $accum) }Asim Jehangir
If two tables are merged, you can add a paragraph break with RTF directive
\par. Therefore, replace this line in your codewith this line
Hi Attaullah Shah,
Thanks for this super useful command. Is it possible to use this command to export tables to Excel (instead of Word)?
Option to export excel will be available in asdocx, which is a premium version of asdoc. See more details here https://fintechprofessor.com/stata-programs/asdocx/
Anders, can you please send a sample of your data to see what might be causing this error?
You can send it at attaullah.shah@imsciences.edu.pk
Hi Attaullah Shah!
I want to customize the numbers in each column with a different decimal. How do I need to write the code? You only show how to change the decimal for the table in total.
Many thanks.
Esther
Esther
I am working on the asdocx version which will have this possibility. You can check the updates concerning asdocx here
http://fintechprofessor.com/asdocx
Hello Attaullah Shah,
Does this function work well categorical variables to tabulate frequencies and percentages of various variables and their categories listed under each variable?
Imma
Yes, asdoc works with categorical variables. See this example
What about table breaks for tables with 25 variables that cannot fit in one page. What is the asdoc command?
asdoc is out of structure range. As all the variables cannot fit into a page
Thanks
Happy
I have a plan to add page breaks to asdocx. You can find out details about asdocx here https://fintechprofessor.com/asdocx/
Hi Attaullah Shah,
I specifically would love to use the asdoc row function to create a publication quality table with all the different values under each variable showing the frequency and percentage.
Hello Attaullah Shah,
Please, can you tell me how can I merge two cells with asdoc ?
I’m trying to build this table :
I would like that “Sendind and Receiving Households” could be merge with the two first cells of the table to avoid line break because it’s a long name.
Bests
Anderson
I did not get your point. Can you please post a more comprehensive example to elaborate on what you are trying to do?
Dear Professor Shah,
I have a frequency table of var1 and var2. Each variable has 4 values (1, 2, 3, 4) but I only want to report the first three values of var1 (i.e., instead of a 4×4 table I would need a 3×4 table).
It would look like this:
1 2 3 4
1 x x x x
2 x x x x
3 x x x x
(the last row containing the frequency of var1’s value 4, I really need it to be dropped).
Thank you in advance!
This is possible in asdocx, which has a dozen more powerful features. See details here
https://fintechprofessor.com/asdocx/
Thank you so much for the prompt reponse!
You have a great weekend Sir,
Dear Professor Shah,
When I try to create my own summary statistics table with the option “row” and “rowappend”, I keep getting two seperate tables in my word.
The first row I create is the column headings: row(\b Variable \b0 , N, Mean, SD, Min, P25, Median, P75, Max)
When I open my word, it will be a standalone row/table.
My starting code is:
[
asdoc, row(Variable, N, Mean, SD, Min, P25, Median, P75, Max) title(Summary Statistics) save(sumstat) replace
* Subheading: Firm-level Climate Risk Measures
asdoc, row(\i, \i Firm-level Climate Risk Measures \i0, \i, \i, \i, \i, \i, \i, \i) *rowappend or append*
…]
I am trying to create a table, that will include sub-headings (example with 1 of the 4 parts):
* Subheading: Firm-level Climate Risk Measures
asdoc, row(\i, \i Firm-level Climate Risk Measures \i0, \i, \i, \i, \i, \i, \i, \i)
sum Trans_risk, detail
asdoc, row(Trans risk, `r(N)’, `r(mean)’, `r(sd)’, `r(min)’, `r(p25)’, `r(p50)’, `r(p75)’, `r(max)’) dec(2) rowappend
sum Trans_risk_pro, detail
asdoc, row(Trans risk pro, `r(N)’, `r(mean)’, `r(sd)’, `r(min)’, `r(p25)’, `r(p50)’, `r(p75)’, `r(max)’) dec(2) rowappend
sum Trans_risk_npro, detail
asdoc, row(Trans risk npro, `r(N)’, `r(mean)’, `r(sd)’, `r(min)’, `r(p25)’, `r(p50)’, `r(p75)’, `r(max)’) dec(2) rowappend
sum Phy_risk_acute, detail
asdoc, row(Physical risk acute, `r(N)’, `r(mean)’, `r(sd)’, `r(min)’, `r(p25)’, `r(p50)’, `r(p75)’, `r(max)’) dec(2) rowappend
sum Phy_risk_chronic, detail
asdoc, row(Physical risk chronic, `r(N)’, `r(mean)’, `r(sd)’, `r(min)’, `r(p25)’, `r(p50)’, `r(p75)’, `r(max)’) dec(2) rowappend
[…]
When I run the command for the 4 parts, it will remain 1 table, and the sub-headings are also presented in the cell as it is supposed.
I have tried using the option “rowappend” and “append”, but with no luck of just getting one combined table.
Is it possible to be format the table as one whole, or will it always seperate the heading row with the rest?
***OBS I have tried doing it with the macro functions and it the result is the same
Best,
Rasmus