

In Stata, we can use the two-way graph type for plotting abnormal returns or cumulative average abnormal returns against the days of the event window. Suppose that we have event window of 7 days, and have the following data
| days | caar1 | caar2 | caar3 | caar4 |
| -3 | 0 | 0 | 0 | 0 |
| -2 | -.0043456 | -.0050911 | .0000683 | .0000504 |
| -1 | -.0034961 | -.0023533 | .0037439 | .0042783 |
| 0 | -.0034278 | .0019828 | .0090661 | .0106628 |
| 1 | .0016178 | .0067894 | .0131572 | .0156011 |
| 2 | .0039689 | .0104367 | .0190594 | .0221428 |
| 3 | .0040022 | .0129478 | .0218878 | .0267722 |
to plot the first caar1, we shall type :
graph twoway line caar1 days, xline(0)
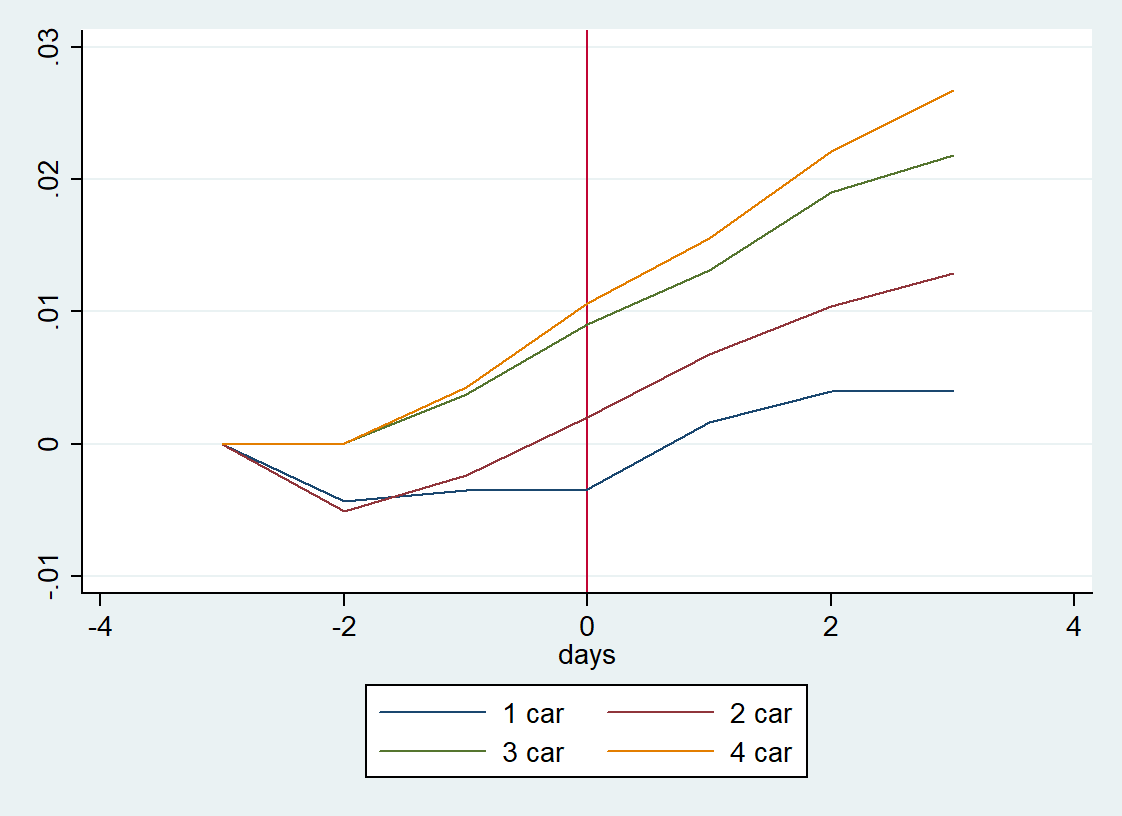
If we were to plot all caars, then
graph twoway line caar* days, xline(0)
[addthis tool=”addthis_inline_share_toolbox”]
This was useful, thanks.