

Version 2.3 of asdoc adds the following features for reporting detailed regression tables.
1. Reporting confidence interval
2. Suppressing confidence intervals
3. Suppressing the stars which are used to show significance level
4. Customization of significance level for stars
These features are discussed in details below. If you have not already studied the features of asdoc, you can visit this page that lists the table of contents of what asdoc can do. You can also read this one paragraph introduction to asdoc. The following line of code will install this beta version of asdoc from our website
net install asdoc, from(http://fintechprofessor.com) replace
help asdoc
Details of the new features
The new features related to creating detailed regression tables with asdoc are discussed below with details.
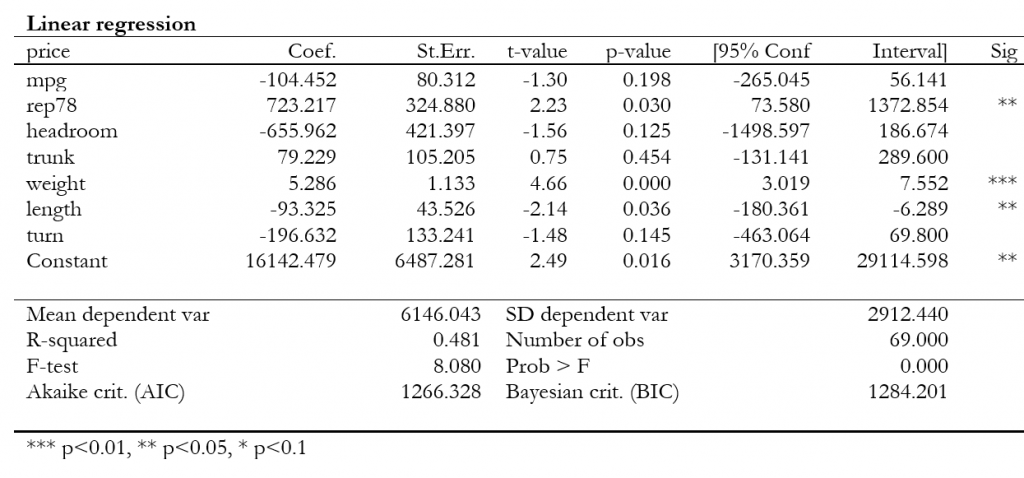
1. Confidence interval
I received several emails and comments on blog posts suggesting the addition of confidence intervals (CI) to the detailed regression tables created by asdoc. In version 2.3 onwards, confidence intervals are shown by default. This means that we do not have to add an additional option to report CI. See the following example.
sysuse auto, clear
asdoc reg price mpg rep78 headroom trunk weight length turn , replace
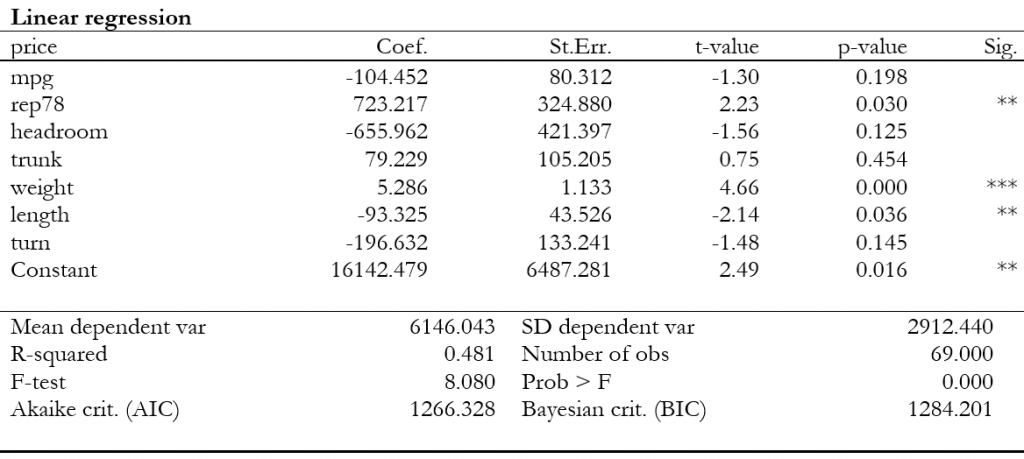
2. Suppressing the confidence interval
If confidence intervals are not needed, we can use option noci. For example
asdoc reg price mpg rep78 headroom trunk weight length turn , replace noci
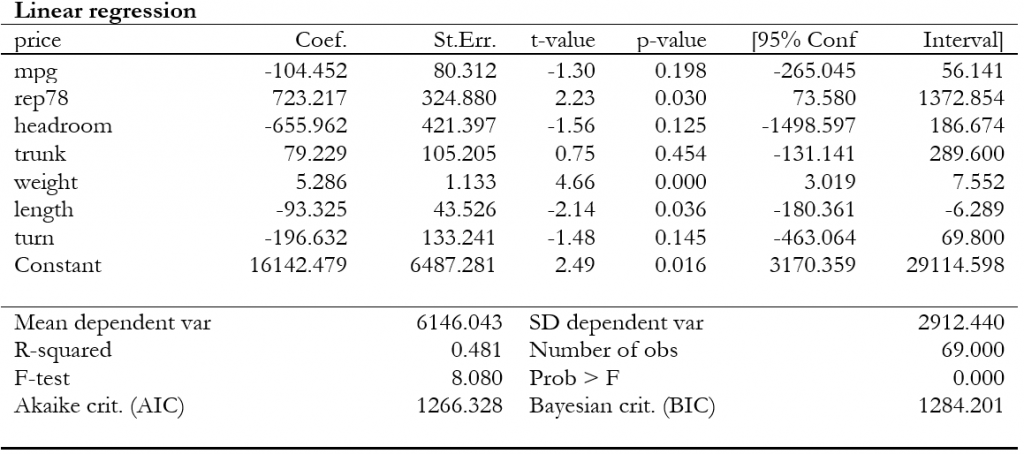
3. Suppressing stars
Similarly, if we are not interested in reporting significance stars, we can use option nostars. For example,
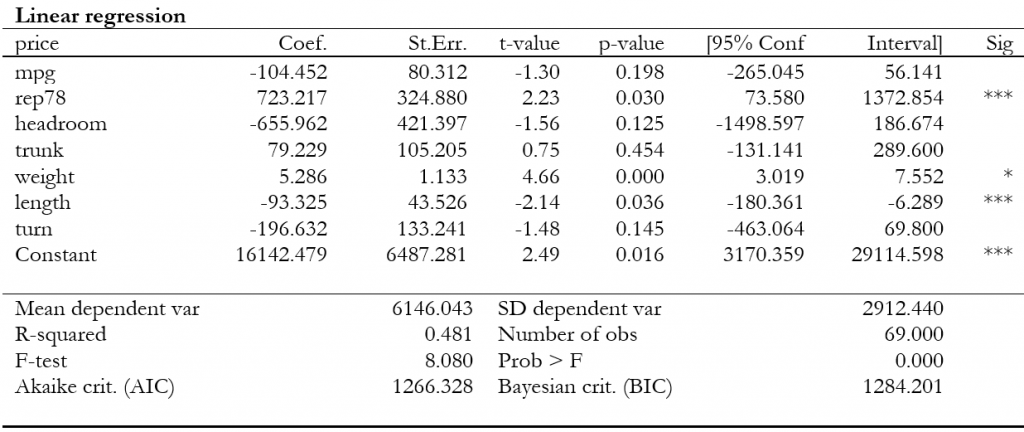
4. Setting custom significance level
The default significance levels for reporting stars are set at : *** for p-values <=0.01; ** for p-values <=0 .05, and * for p-values <=0.1. However, now we can set our own levels for statistical significance using option setstars. An example of setstars option looks like:
setstars(***@.01, **@.05, *@.1)
As we can see from the above line, setstars separates each argument by a comma. Each argument has three components. The first component is the symbol (in our case it is *) which will be reported for the given significance elve. The second component is the @ sign that connects the significance level with the symbol. And the third component is the value at which the significance level is set. So if we want to report stars such that
* for p-value .001 or less
** for p-value .01 or less
*** for p-value .05 or less
We shall write the option setstars as
setstars(*@.001, **@.01, ***@.05)
Continuing with our example, let us use the above option to report our defined level of stars.
asdoc reg price mpg rep78 headroom trunk weight length turn , ///
      replace setstars(*@.001, **@.01, ***@.05)
Dear Dr. Attaullah Shah,
I am studying your powerful Stata package of asdoc. It doesn’t seem to be available for logistic regression when I want to output OR, right?
Thank you!
Dear Zhengya
Yes, it can be used with logistic regression. See this thread, post 4 and #9 where I have shown how to do it.
https://www.statalist.org/forums/forum/general-stata-discussion/general/1437027-exporting-logistic-regression-outputs-or-and-ci-to-excel
Dear Dr. Attaullah Shah,
Thank you for getting back to me. The package will work if I wanna get OR and the 95%CI for OR?
Dear Dr. Attaullah Shah
Tried to update to ver. 2.3 as you recommend.
I have still ver. 2.2??
David Straarup
Did you install asdoc from SSC from this website? I have not yet uploaded version 2.3 to SSC as I need to test it further. Version 2.3 is available on this website, to download this beta version, you can type the following in the Stata command window
Update: The new version is now available on SSC, to install
Yes, tried update from your location.
The version is still ” Oct 23, 2018, ver 2.2.0″ in “help asdoc”!
Don´t know why….now it works with CI-interval.
Thank you!
Dear Dr. Attaullah Shah,
I am studying your powerful Stata package of asdoc. When the label or title include Chinese, the result appear messy code in the word. It doesn’t seem to support unicode ?
Thank you!
Dong: I replied to a similar query on Statalist here – posts 45-46, where Chen Samulsion asked about the possibility of passing Chines characters from Stata to a Word file using asdoc. My reply was that getting Chinese characters in an RTF file is a pain in the neck. Usually, getting Chinese characters programmatically into an RTF file does not seem straightforward, one has to first convert the letters to Unicode and then render it properly in the RTF file.
I think similar is the case with Nordic characters. Right now, I am struggling with finding a way out.
I also think you should check to report the correct std errors with the transformed coefficients in logit. The standard error reported by logit with the or optionis computed using the delta method. For example, to manually compute the standard errors:
        use http://www.stata-press.com/data/r15/bangladesh.dta, clear
        logit c_use age i.urban, vce(cluster district) nolog
        logit c_use age i.urban, vce(cluster district) or nolog
        ** after -logit, or-, e(b) and e(V) still store the result of the coefficients rather than the ORs
        mat V=e(V)
        display sqrt(exp(_b[age]*2)*el(V,1,1))
Stata uses the delta method here because the logit coefficients are approximately normally distributed comparing with the ORs – See:
https://www.stata.com/support/faqs/statistics/delta-rule/
Dr Joanna
I have uploaded a revised version of asdoc, it solves the mentioned problem and brings within few other updates. To update, please type the following line and paste in Stata
Dear Dr. Attaullah Shah,
Thank you for your guidance with asdoc.
When you change stars for a significance level (P-values), the footnote below the table doesn’t automatically correspond to the star changes in the table?
Please install the updated version of asdoc, that has an update to setstars() option. The new version also changes the footnote accordingly.
The new version of asdoc can be installed from my site. Copy and paste the following line in Stata and press enter.
Please note that the above line has to be copied in full. After installation of the new version, then restart Stata.
Please do remember to cite asdoc. To cite:
In-text citation
Tables were created using asdoc, a Stata program written by Shah (2018).
Bibliography
Shah, A. (2018). ASDOC: Stata module to create high-quality tables in MS Word from Stata output. Statistical Software Components S458466, Boston College Department of Economics.
Dear Professor Shah,
thank you very much for your asdoc feature, which is just wonderful!! I am wondering how I can change the confidence interval for regression tables from 95% to 99%? I would like to report the 99% upper and lower bounds, but cannot find any information on how to do this with asdoc at your homepage.
Thank you very much for your help and advice!
Hello Eva
You can use the level(99) option to report 99% confidence interval
Example
Please cite asdoc in your research.
In-text citation
Tables were created using asdoc, a Stata program written by Shah (2018).
Bibliography
Shah, A. (2018). ASDOC: Stata module to create high-quality tables in MS Word from Stata output. Statistical Software Components S458466, Boston College Department of Economics.
Dear Dr. Attaullah Shah ,
I was hoping to ask for your help in using your asdoc program in stata. I have been really impressed with how nicely the output is generated in word for multivariable models, certainly much better than what I’ve been able to achieve in the past from various attempts at esttab/estout/regout etc. I am undertaking my PhD at the University of Melbourne. I have read the help file but still have a few questions.
My first issue that I’m having is that I am having is that i am running poisson regression models (or perhaps nbreg) and I would like the output to be the exponential of the coefficient to represent IRR’s. I read the following link of discussion for logistic regression and by your conversation it appears that with the logit command odds ratios are presented in the table. I have “eform” in my code which seems to be being ignormed when I add asdoc in front of the model. I’m not sure if there is another way to overide the coefficients?
https://www.statalist.org/forums/forum/general-stata-discussion/general/1437027-exporting-logistic-regression-outputs-or-and-ci-to-excel
Secondly, I am trying to tabulate the univariable models to include in a supplementary file for my publication from the univariable screening process as previously I have copy-pasted and with a very large number of variables this is becoming very laborious. I essentially need each univariable model to have the e^coefficient 95%ci and p-value without a constant.
The code I was running was going to have for about 20 variables(where I am looking at the effect of trainer and workload factors on race performance with the exposure as the number of races undertaken)
**I was hoping to generate each variable as another line in the same table but the way I have coded this it starts a new table for each variable
**the notse I thought from the help file would drop the t statistic and the standard error but these columns still stay in the output per this code
do not seem to work
** I thought the label command would use the variable labels but it outputs the 0.category, i.category etc
** the other thing I was trying to do was to get multiple models to output side by side to have the predictor on the left and then different outcomes sequentially (i have outcomes of wins, places and prize money in separate models). I thought the wide command might help but it is not really what I’m after. I am happy to merge columns of different model tables later though in the Word if this is not possible.
I wondered if I could loop the code over the list of variables, but I haven’t been able to find any examples online of people trying this.
Apologies for the lengthy email. Any assistance would be greatly appreciated.
Can you please help me to report pvalue instead of standards errors in nested table outcome of asdoc.
Dear Mr. Shah
I am using asreg by industry and year, i wanted to generate a table using asdoc. however it seems asdoc does not work with asreg the way it works with reg. when i enter command: by inudustry year: asdoc asreg var1 var2…., replace
it gives error. I want high quality tables for with significance level stars, se etc
asreg does not output any result on the screen, rather it writes the results to the data. So if you want to output the results using asdoc, you can use
listcommand. See this example*run company wise regressions webuse grunfeld, clear bys company : asreg invest mvalue kstock duplicates drop company, force asdoc list company _Nobs _R2 _adjR2 _b_mvalue _b_kstock _b_cons, replace +------------------------------------------------------------------------------+ | company _Nobs _R2 _adjR2 _b_mvalue _b_kstock _b_cons | |------------------------------------------------------------------------------| 1. | 1 20 .92135403 .91210157 .11928082 .37144481 -149.7824 | 2. | 2 20 .47086233 .40861084 .17485601 .38964188 -49.198313 | 3. | 3 20 .70530671 .67063691 .02655119 .15169387 -9.9563082 | 4. | 4 20 .91357845 .90341121 .07794781 .31571818 -6.1899547 | 5. | 5 20 .68040764 .64280854 .16237772 .00310173 22.707115 | |------------------------------------------------------------------------------| 6. | 6 20 .9521422 .94651187 .13145485 .08537425 -8.6855436 | 7. | 7 20 .76350084 .73567741 .08752719 .12378141 -4.499533 | 8. | 8 20 .7444461 .71438094 .05289412 .09240652 -.50938763 | 9. | 9 20 .66551452 .62616329 .07538795 .08210356 -7.7228397 | 10. | 10 20 .64315782 .60117638 .00457343 .4373692 .16151866 | +------------------------------------------------------------------------------+Dear Dr. Attaullah Shah,
Thank you for this command. I am wondering if it is possible to have the coefficient and SE side-by-side instead of the SE below the Coef. Something like this
Zachary
This option is available in wide regressions. See the help file of the asdoc, section 4.3 Wide Regression
Here are few examples from the help file:
4.3.3. Reporting se / t-values side-ways
Example 28
        sysuse auto
        asdoc reg price mpg rep78, wide replace t(side)

        Add another regression where the dependent variable is trunk
        asdoc reg trunk mpg rep78, wide t(side)

        Add third regression where the dependent variable is weight
        asdoc reg weight mpg rep78, wide t(side)
Note: we can report standard errors (se) instead of t-values by replacing t(side) with se(side) in the above examples.
Dear Attaullah Shah,
Thank you for asdoc.
Is it possible to have confidence intervals in a nested model?
And can i present an interaction from a linear regression using asdoc?
Thanks
Ali
Amazing, Attaullah! Thank you so much.
Dear Dr. Attaullah Shah,
The regression output table shows the regression robust standard error in the parenthesis instead of t value. Can we modify the command to display t value instead of standard error?
Ilyas, you can use the rep(t) option.
See this example:
Hi Professor Shah,
Do you know how to include the confidence intervals when using asdoc with ttest output? I would love to get the bracketed upper and lower bound of the CI, just like the regression asdoc output, but for ttest results.
Thanks and warm regards,
Shelby
Hello Sir
Firstly, I am really thankful for your codes for creating publication style tables.I have been following your website FinTechProfessor for all my stata results.
I have used asdoc to create a nested table with quantile regression results (with sample weights). The standard errors are placed in a separate line below the coefficients which is taking up too much space as I have large number of variables. I wanted to know if there is any way that I can get the standard errors just next to the coefficients (coefficients with significance stars) in the same line?
Also, I wanted different decimal limits for different statistics i.e. 1 for coefficient and 2 for standard errors. Is this possible with asdoc?
Format that I require is coeff***(s.e.)
Dear Professor Shah,
Is it possible to have leading zeros in your output, for example 0.05 instead of .5?
Thank you in advance for your time. my code is
asdoc xtpoisson y x1 x2 x3, re vce(robust) exposure(pts) append nest label abb(.) nest setstars(***@.001, **@.01, *@.05) dec(5) stat(aic bic).
Thank you for your time.
Hello Veline
I have implemented it asdocx, that has many other useful features. You can find more about asdocx here https://fintechprofessor.com/asdocx/
Hi, Professor,
setstars() function does not work for me. It said setstars unrecognized.
Would you mind kindly help me with what do I miss?
Sorry, I was doing for correlation matrix.
To get a helpful reply, please post the asdoc command that you used.
Dear Attaullah Shah,
The following command isn’t working for me, any idea what I am doing wrong
No significance stars appear in my table
setstars(***@.001, **@.01, *@.05) replace
Dear Boris, it has been fixed. Please also see asdocx https://fintechprofessor.com/asdocx/, that is a more flexible and powerful version of asdoc.
Dear Attaullah Shah,
I also want to set other significance levels than the default. I used the setstars() command, but in my table there do not appear any stars. I used this command:
asdoc pwcorr universalism_domestic universalism__foreign universalism__global universalism_mean, setstars(*@.05, **@.01, ***@.001) replace
Do you have any idea, why the stars don’t show up?
Many thanks in Advance
Dear all,
Iam trying to use asdoc with a fractional regression command and logit link but the odds ratios get automatically changed to coefficients (see command below). Has any used this before to assist me!? Thanks
Have you tried the
eformoption instead of or. I think I had worked on it in asdocx.asdocx is now available
A more powerful and flexible version of asdoc is now available. I call it asdocx. You may like to check the details here
https://fintechprofessor.com/asdocx
Please do remember to cite asdoc. To cite:
In-text citation
Tables were created using asdoc, a Stata program written by Shah (2018).
Bibliography
Shah, A. (2018). ASDOC: Stata module to create high-quality tables in MS Word from Stata output. Statistical Software Components S458466, Boston College Department of Economics.
Dear Dr. Attaullah Shah,
I tried to use setstars command but it states its unrecognized. No significant stars appear in my table. Do you have a solution for this?
setstars(**@.01, *@.05, ***@.1)
Thank you for this package! It seems it will do what I need, but I am having trouble getting the output I would like. I have about 20 logistic regressions I need to run, all with the same dependent variable but different independent variables. I would like a table listing the OR and CI for the independent variable of each of the models in a succinct table. I think the wide option is what I would like (it seems to output it in the format I would like), but I can’t get it to output the OR (it will only do the coefficient) or the CI. I would also like to drop the adjustment variables I have in the model, but I can’t get it to do that when using the wide option, either. Any help would be greatly appreciated!
Amanda
You can do this with asdocx. Here are two alternative ways for doing this:
1. Use the sideways options
2. Use the reg1 template
Hi! I’m running models for my dissertation and am wondering if there is any code to output stars for model significance (e.g.., if my Wald Chi2 is 33.504, and is significant at the 0.05 level, how can I get asdoc to return 33.504***?). Thank you :)
Katie
Hi!
What can we do to export marginal effects results (multinomial logit) to Word? I have tried asdoc with margins, dydx() but it still gives the logit coefficient rather than marginal effects,
Dear Professor Shah,
How can we report 95% CI in a regression table? I can see option for suppressing CI, but I couldn’t find an option to present 95% CI when we use “notse” option.
sysuse auto, clear
asdoc reg price mpg rep78, nest replace
asdoc reg price mpg rep78 headroom weight, nest append
asdoc reg price mpg rep78 headroom weight foreign, nest append drop(headroom weight foreign) nostars notse nor2 save(Table_m1.doc)
Thank you.