asdoc installation
If you have not already studied the features of asdoc, you can visit this page that lists the table of contents of what asdoc can do. You can also read this one paragraph introduction to asdoc. The following line of code will install asdoc from SSC
ssc install asdoc
help asdoc
Reporting t-tests with asdoc
Before we make the t-test results table for our example data, let us breifly explore the options available in asdoc for making a t-test results table.
Whether it is one-sample t-test or two-sample or other forms, asdoc manages to report the results line by line for each test. asdoc also allows accumulating results from different runs of t-tests. For this purpose, the option rowappend of asdoc really comes handy. With the sub-command ttest , we can use the following options of asdoc to control asdoc behavior.
(1) replace / append
(2) save(filename)
(3) title(text)
(4) fs(#)
(5) hide.
(6) stats()
(7) rowappend.
These options are discussed in detail in Section 1 of asdoc help file. Option stats and rowappend are discussed below:
Option stat()
Without stat() option, asdoc reports the number of observations (obs), mean, standard error, t-value, and p-value with t-tests. However, we can select all or few statistics using the stat option. The following table lists the keywords and their details for reporting the desired statistics.
keyword | details |
n | Number of observations |
mean | Arithmetic mean |
se | Standard error |
df | degrees of freedom |
obs | Number of observations |
t | t-value |
p | p-value |
sd | standard deviation |
dif | difference in means if two-sample t-test |
Option rowappned
ttest tables can be constructed in steps by adding results of different t-tests to an existing table one by one using option rowappend. There is only one limitation that the t-tests are performed and asdoc command applied without writing any other results to the file in-between.
An example
Suppose we have the following data set with variables r0, r1, r2, r3, and y. The data can be downloaded into Stata by
use http://fintechprofessor.com/ttests.dta, clear

The variables ro-r3 are the numeric variables for which we would like to conduct one-sample ttest whereas variable y is a numeric date variable that tracks years. We wish to conduct a ttest for each of the r0-r3 variables and in each year and make one table from all such tests.
Without using a loop
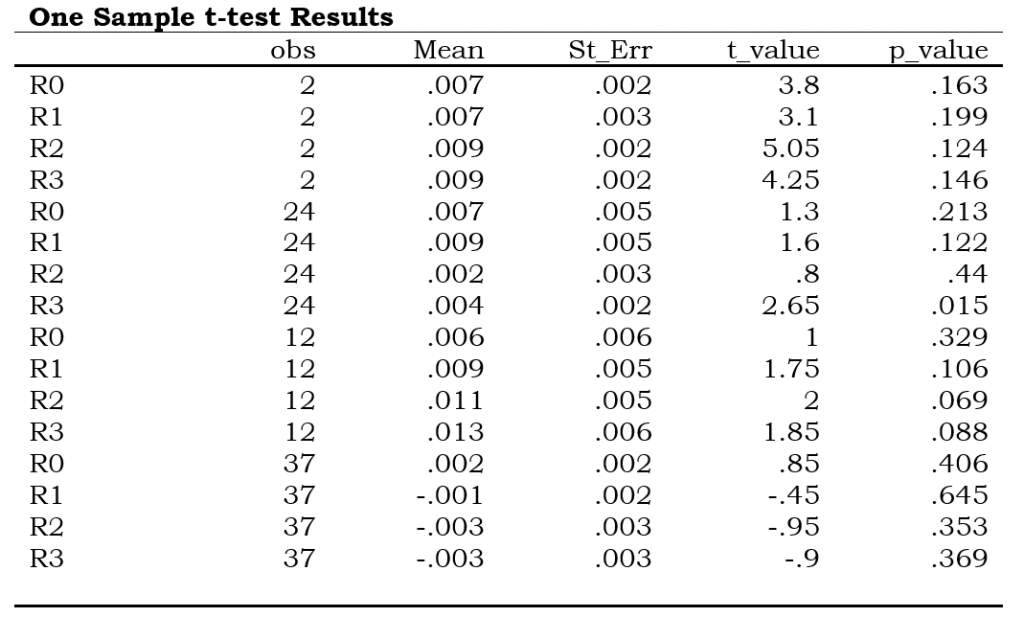
asdoc ttest R0==0 if Y==2009, replace title(One Sample t-test Results)
asdoc ttest R1==0 if Y==2009, rowappend
asdoc ttest R2==0 if Y==2009, rowappend
asdoc ttest R3==0 if Y==2009, rowappend
asdoc ttest R0==0 if Y==2010, rowappend
asdoc ttest R1==0 if Y==2010, rowappend
asdoc ttest R2==0 if Y==2010, rowappend
asdoc ttest R3==0 if Y==2010, rowappend
asdoc ttest R0==0 if Y==2011, rowappend
asdoc ttest R1==0 if Y==2011, rowappend
asdoc ttest R2==0 if Y==2011, rowappend
asdoc ttest R3==0 if Y==2011, rowappend
asdoc ttest R0==0 if Y==2012, rowappend
asdoc ttest R1==0 if Y==2012, rowappend
asdoc ttest R2==0 if Y==2012, rowappend
asdoc ttest R3==0 if Y==2012, rowappend
And appreciate the results

Explanation
1.In the first line of code, we wrote asdoc ttest in the beginning of the line. This is how we use asdoc with Stata commands. We just add asdoc to the beginning of any Stata command and that’s all.
2. We used two options of asdoc in the first line of code: the replace and title(). Replace will replace any existing file with the name Myfile.doc and title will add the specific test as a title to the output file.
3. In the second line of code, we added option rowappend() that will append the results to the existing table in the file Myfile.doc
4. And the process continues until all t-tests are estimated.
Hello Dr. Shah, thank you so much for creating this program. This is such an amazing contribution. I am using asdoc to perform t-tests and I was wondering if there was any way to further customize the stats that are being reported. Namely, I was wondering if I could get obs, means, SDs for each of my two groups, as well as confidence intervals for the mean diff.
Jeff D
Thanks for your comments. For customized statistics, you can use the option stat() as shown above in the post. However, confidence intervals are not yet available in asdoc with ttest commands.
Hello There,
Thank you for this program. Is there a way a could report one-tailed t tests statistics? Currently the program reports are two-tailed.
Thanks
Andre Moura
I did not think of it before, thanks for the suggestion. I shall consider your suggestion in future updates.
hello sir could i have your email
Hello Dr. Shah,
Hope you are doing fine. First, I want to thank you for the creation of ASDOC.
My question is related to a simple the tabulate command and the ttest command.
For the tabulate, I will like to see a table with the total and the end. I’m using the following code:
For the ttest, I’m trying to use the following command:
With the tabulate, the table in the word document is not showing the total at the button of the table. The t test is giving me the error:
I discovered my mistake.
I was needing to install the last version of asdoc to see the totals. In addition, I was coding incorrectly the Ttest.
ASDOC is awesome!
Thanks,
Felix.
Hello,
I was trying to use asdoc command with paired t-test but I am getting an error that I could not fix.
Here is my line of code:
the error says:
When I put abb(4) in the code as an option, still I am getting the same error. I read the help file but haven’t found any solution.
Thanks for any help.
David
The problem is caused by the lengthy names of your variables. Stata matrices do not allow lengthy names. When I shorten the names by a few letters, the command works fine. See this example
Attaullah you are a genius. Thanks for this handy code. I have a question. How can we control the decimal places for the t-statistics? What if I want to see 4 decimals for the statistics. The code below tests whether a variable is significantly different from zero for a specific group. How can I show more decimal places for the t-statistics and the p-values?
George
Thanks for your kind words. I have revised asdoc to report customized decimal points with the t-values in ttests. For example,
The new version of asdoc can be installed from my site. Copy and paste the following line in Stata and press enter.
Please note that the above line has to be copied in full. After installation of the new version, then restart Stata.
Please do remember to cite asdoc. To cite:
In-text citation
Tables were created using asdoc, a Stata program written by Shah (2018).
Bibliography
Shah, A. (2018). ASDOC: Stata module to create high-quality tables in MS Word from Stata output. Statistical Software Components S458466, Boston College Department of Economics.
Thanks a lot Shah!
Hello, the following command
Gives me the following error message
If I use the same command with the option stat(mean t p), no error message occurs. I am using asdoc on mac, could that be an issue?
Anna Meier
I have fixed the error. The new version of asdoc can be installed from my site. Copy and paste the following line in Stata and press enter.
Please note that the above line has to be copied in full. After installation of the new version, then restart Stata.
Please do remember to cite asdoc. To cite:
In-text citation
Tables were created using asdoc, a Stata program written by Shah (2018).
Bibliography
Shah, A. (2018). ASDOC: Stata module to create high-quality tables in MS Word from Stata output. Statistical Software Components S458466, Boston College Department of Economics.
Thank you or your quick response and fixing the problem! Unfortunately, after having updated the version, my command from the earlier post does not retrieve the results for the scalar r(t) anymore for a two-sample t test but for a one-sample t test. Has that something to do with the update of the command asdoc?
Anna Meier
asdoc runs several programs internally to get various statistics, and there are chances that the r() and e() macros left behind by some Stata commands are over-written in this process. Therefore, if you need to get these stats, then you can run the Stata commands without asdoc prefix. So, this way you need to run the commands twice, i.e. once with asdoc and then without asdoc.
Thank you for your answer and sorry for not being clearer in my previous response!
The command
runs a one-sample t test instead of a two-sample ttest since the last update of asdoc.
Is there a way to include significance stars in one sample ttest?
Tahks in advance
Pedro Coelho
Currently, stars are not available for ttests. I shall add them in the asdocx package. You can see the updates on asdocx here http://fintechprofessor.com/asdocx
Can asdoc accomodate unpaired ttests?
Hi there,
I wanted to apply ttest y, by(x) and report difference across the group x. How would I use asdoc on this occassion?
Thomas, you just simply add asdoc to the ttest command
example
Thank you Prof. This is the message I get from STATA
“matrix accum not found”
Thomas
Please install the latest version of asdoc and if the problem persists, then please send a sample of your dataset and the Stata code that reproduces the error.
The new version of asdoc can be installed from my site. Copy and paste the following line in Stata and press enter.
Please note that the above line has to be copied in full. After installation of the new version, then restart Stata.
Please do remember to cite asdoc. To cite:
In-text citation
Tables were created using asdoc, a Stata program written by Shah (2018).
Bibliography
Shah, A. (2018). ASDOC: Stata module to create high-quality tables in MS Word from Stata output. Statistical Software Components S458466, Boston College Department of Economics.
Hi Prof. Love this tool. Is there a way asdoc can report the two-tailed p-value when computing a one-sample t-test?
Molly
If you type
it opens the asdoc help file. In Section 8, I have listed various options that can be used with the
ttest
. For reporting p-values, you can use thestat(p)
option. See the following examples:Hi Prof. Thanks for the quick reply. I realized my issue was not with reporting p-value but rather that I’m having an issue with setting the first variable equal to something other than 0. For example, I’d like to be able to do this:
asdoc ttest instruct_avg==1.61 if CBO_n==1
But the t-value and p-value it reports appear as if instruct_avg had been ==0. Do you have any insight?
I have updated the asdoc. The new version of asdoc can be installed from my site. Copy and paste the following line in Stata and press enter.
Code:
Please note that the above line has to be copied in full. After installation of the new version, then restart Stata.
Hellow
i’m runnig this foreach loop who works well.
Now i would like to include in the loop the command asdoc to export a ttest table including all the variables in the loop. I tried in this way: ”
”
But the loop stops after the first variable ttest and reports this error: “invalid ‘sep'”
Do you know how to solve it?
or another way to export the desired table using a foreach loop?
Regards.
Nick.
If you can send me your data, I can better pinpoint the problem. Looking at the loop, I can see that you are using three commas. Stata allows only one comma to separate the main command and options. This line should be:
Dr. Shah, I have installed the latest asdoc from your website and restarted STATA, however asdoc is still giving me “no observations” as an error when I run:
asdoc ttest x==y, unpaired…
Yet when I run:
ttest x==y, unpaired… I get the results.
Can asdoc run unpaired t-tests or is that limited to asdocx?
Hi birodar. I have questions. How to get xtunitroot test results via asdoc in the table below.
asdoc does not have special package for xtunitroot test. However, it can be added to asdocx, that has tons of other premium features https://fintechprofessor.com/asdocx/