

Forum Replies Created
-
AuthorPosts
-
in reply to: How to report p-values in asdoc nested table #3117
Christopher
I just checked it and thedec()option works fine. Perhaps, after updating asdoc, the old macros were still in the memory, please restart Stata and check again. Or perhaps, you may like to reinstall asdocThe new version of asdoc can be installed from my site. Copy and paste the following line in Stata and press enter.
net install asdoc, from(http://fintechprofessor.com) replace
Please note that the above line has to be copied in full. After installation of the new version, then restart Stata.
Please do remember to cite asdoc. To cite:
In-text citation
Tables were created using asdoc, a Stata program written by Shah (2018).Bibliography
Shah, A. (2018). ASDOC: Stata module to create high-quality tables in MS Word from Stata output. Statistical Software Components S458466, Boston College Department of Economics.in reply to: additional regression statistics error #3104Thanks for reporting this. Turns out that the R2 statistic is causing this problem. R2 is the default statistic and if another R2 is entered, it causes the error. For time being, you can drop R2. I shall update asdoc to handle this error.
sysuse auto, clear asdoc reg price mpg rep78 headroom i.foreign , robust replace nest /// drop(i.foreign ) cnames(Pooled OLS) save(Regressions1) /// add(Time Dummy, YES) font(Times New Roman) fs(10) dec(4) /// stat(N, df_m, df_r, F)Since Stata treats date variables as numeric, asdoc reports the numeric variable without formating it as a Stata date. I think it can be fixed sometime in future, but at the moment, the trick is to convert the date variable first to a string and then use it with asdoc, like this
tostring Time_period, gen(time) u force
bys time:asdoc sum Lerner_w
Assalam-O-Alaikum
Thanks for your email and kind words. Can you please send a sample of your data to reproduce the error.
in reply to: asreg average adjusted r squared #3076Hello
The error message shows that you have not loaded data in Stata. If the error is not related to data, then please typewhich asregand send the output from that above code. Also, if you can please share your dataset for debugging the issue.
The mistake you are making is the declaration of the Age text as a macro, by enclosing it in the macro symbols. In fact, Age is just a text, it is not declared as a local macro with the loc command. The correct is given below.
clear
set obs 100
gen mean_age = int(uniform() * 100)
gen stupd = mod(_n,2)

ttest mean_age, by(stupd)

*Get the relevant statistics

loc obs1 = `r(N_1)'
loc obs2 = `r(N_2)'
loc mean1 = `r(mu_1)'
loc mean2 = `r(mu_2)'
loc dif = `mean1' - `mean2'
loc stde = `r(se)'
loc pval = `r(p)'
dis `dif'

sum mean_age if stupd == 0
loc max1 = `r(max)'
loc min1 = `r(min)'

sum mean_age if stupd == 1
loc max2 = `r(max)'
loc min2 = `r(min)'

*Write these with asdoc using the row option


asdoc, row(Age, `obs1', `obs2', `min1', `max1', `min2', `max2', `mean1', `mean2', `dif', `stde', `pval') replace
-
This reply was modified 6 years, 3 months ago by
Attaullah Shah.
-
This reply was modified 6 years, 3 months ago by
The xf is an abbreviation that I use for “excluding focal”. There might be circumstances where we want to exclude the focal observation while calculating the required statistics. asrol allows excluding focal observation with two flavors. The first one is to exclude only the current observation while the second one is to exclude all observation of the relevant variable if there are similar (duplicate) values of the rangevar elsewhere in the given window. An example will better explain the distinction between the two options. Consider the following data of 5 observations, where X is the variable of interest for which we would like to calculate arithmetic mean and year is the rangevar. Our calculations do not use any rolling window, therefore the option window is dropped.
Example A:
asrol X, stat(mean) xf(focal) gen(xfocal)
Example B:
asrol X, stat(mean) xf(year) gen(xfyear)

          +---------------------------------------+
          | year     X        xfocal       xfyear |
          |---------------------------------------|
          | 2001   100          350           350 |
          | 2002   200          325           325 |
          | 2003   300          300     266.66667 |
          | 2003   400          275     266.66667 |
          | 2004   500          250           250 |
          +---------------------------------------+
Explanation :
In Example A, we invoke the option xf() as xf(focal). asrol generates a new variable xfocal that contains the mean values of the rest of the observations in the given window, excluding the focal observation. Therefore, in the year 2001, xfocal variable has a value of 350, which is the average of the values of X in the years 2002, 2003, 2003, 2004 i.e. (200+300+400+500)/4 = 350. Similarly, the second observation of the xfocal variable is 325, which is (100+300+400+500)/4 = 325. Similar calculations are made when required statistics are estimated in a rolling window.
Example B differs from Example A in definition of the focal observation(s). In Example B, we invoke the option xf() as xf(year), where year is an existing numeric variable. With this option, the focal observation(s) is(are) defined as the current observation and other observations where the focal observation of the rangevar has duplicates. Our data set has two duplicate values in the rangevar, i.e., year 2003. Therefore, the mean values are calculated as shown bellow:
        +-------------------------------------------------------+
        |       obs 1: (200 + 300 + 400 + 500)/4 = 350          |
        |       obs 2: (100 + 300 + 400 + 500)/4 = 325          |
        |       obs 3: (100 + 200 + 500 )     /3 = 266.66667    |
        |       obs 4: (100 + 200 + 500 )     /3 = 266.66667    |
        |       obs 5: (100 + 200 + 300 + 400)/4 = 250          |
        +-------------------------------------------------------+
Example using a rolling window
*Rolling mean with minimum number of observaton while excluding focal observation
webuse grunfeld bys company: asrol invest, stat(mean) win(year 4) xf(focal)-
This reply was modified 6 years, 4 months ago by
-
This reply was modified 6 years, 4 months ago by
-
This reply was modified 6 years, 4 months ago by
Brian
Thanks for asking. This option is currently not available in asdoc. I welcome patrons to finance specific additions to asdoc. If you are interested, please let me know and I shall work on this. To reach out to me, please contact at attaullah.shah@imsciences.edu.pkin reply to: Restart nested table in asdoc and append mean #3030Alreena
You can use theresetoption for starting a new table. See the following example
*Example Make a nested table of 3 regressionssysuse auto, clear *First regression asdoc reg price mpg rep78, nest replace *Add variable headroom and then nest with existing table asdoc reg price mpg rep78 headroom, nest *Add variable weight and then nest with existing table asdoc reg price mpg rep78 headroom weight, nest *Start a new table, note option reset *First regression asdoc reg price mpg rep78, nest reset *Add variable headroom and then nest with existing table asdoc reg price mpg rep78 headroom, nest asdoc reg price mpg rep78 headroom weight, nest
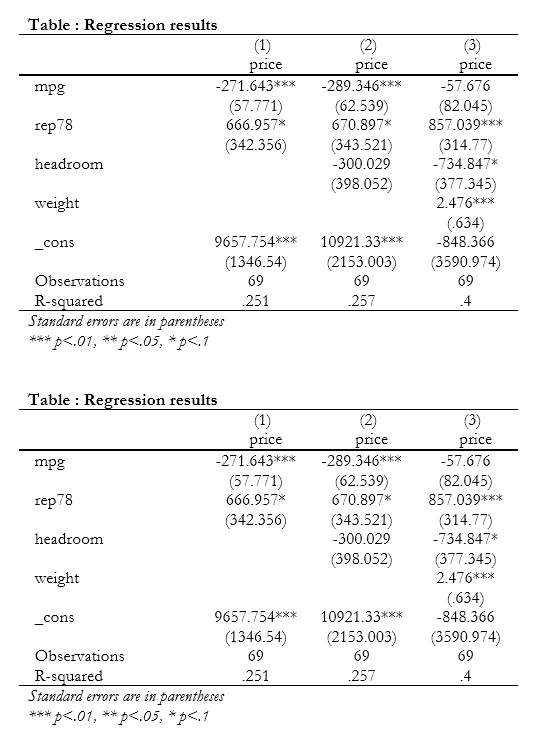
Add additional Statistics to nested table
You can use the
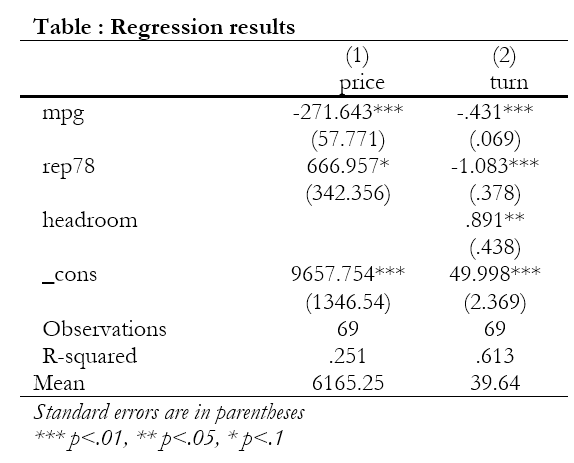
add()option to add additional text or statistics to the nested table. In the following code, I first get the mean of the dependent variable using thesumcommand and write it to the local mean. Then pass on this info to the nested table using theadd(Mean,mean’)` option.*First find mean of the dependent variable
qui sum price
local mean = `r(mean)'
asdoc reg price mpg rep78, nest reset add(Mean, `mean')

*Second regression use turn as the dependent variable
qui sum turn
local mean = `r(mean)'
asdoc reg turn mpg rep78 headroom, nest add(Mean, `mean')
-
This reply was modified 6 years, 4 months ago by
-
This reply was modified 6 years, 4 months ago by
-
This reply was modified 6 years, 4 months ago by
-
This reply was modified 6 years, 4 months ago by
in reply to: asdoc Installation Issue in STATA #3014Can you please provide more details on what you typed and what error message you received from Stata?
in reply to: asdoc in a loop with nest option in Stata #2999Juan Miranda: The question you have asked on StackOverflow is on hold, so I cannot add my answer there. The loop you are using does not use asdoc on each data set that you have. So the correct code would be:
cd "F:\datasets"
local i : dir "F:\datasets" files "*.dta"
foreach file in `i' {
use `file', clear
asdoc reg y x1 x2 x3, append nest rep(t) title(Table 1 MCO per year) dec(3) save(reg)
}
Please also note that there should be no space between
repand(t | se). The same applies to other options of asdoc.
Also note: the optionrep(t)is used to report t-statistics. Instead, if you want to report standard errors, you would userep(se). However, you cannot use bothrep(t|se). Perhaps, you copied this from the help file of asdoc, where the symbol pipe is used to denote that one of these can be used.in reply to: Rho and P values in the same matrix/table #2994Dear Jostein Nordeng
Thanks for your query. Give me some time to explore the mentioned possibilities.in reply to: How to report p-values in asdoc nested table #2991It seems to me your previous installation still resides somewhere on your system. To completely uninstall all instances of asdoc, please do the following.
You should first uninstall asdoc completely using the following code, then reinstall asdoc and then restart your Stata.
net install uninstall_asdoc, from(http://fintechprofessor.com) replace

uninstall_asdoc

*And then install asdoc again
net install asdoc, from(http://fintechprofessor.com) replace
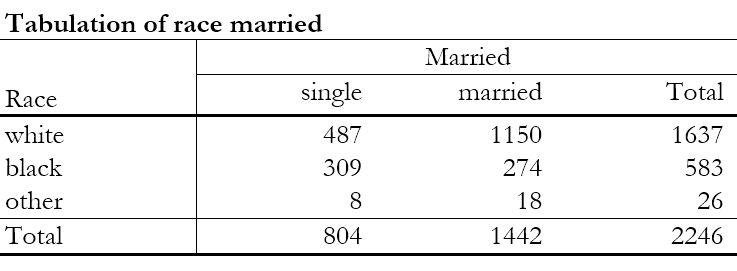
Imma
Yes, asdoc works with categorical variables. See this examplesysuse nlsw88.dta asdoc tab race married
 in reply to: How to report p-values in asdoc nested table #2978
I updated asdoc today to add support for reporting p-values in the nested regression tables. You can now use the option
rep(p)to report p-values. rep() option can also be used to report either :1. t-values using
rep(t)
2. standard errors usingrep(se)
3. p-values with usingrep(p)The new version of asdoc can be installed from my site. Copy and paste the following line in Stata and press enter.
net install asdoc, from(http://fintechprofessor.com) replacePlease note that the above line has to be copied in full. After installation of the new version, then restart Stata.
Following is an example of a nested table with p-values
*Use auto dataset in our example
sysuse auto, clear

*First regression of the nested table
asdoc reg price mpg rep78, nest rep(p) replace

*Second regression, this time I am not using the option replace.
asdoc reg price mpg rep78 trunk , nest rep(p)

*And one more regression
asdoc reg price  rep78 trunk , nest rep(p)

* Following is the output table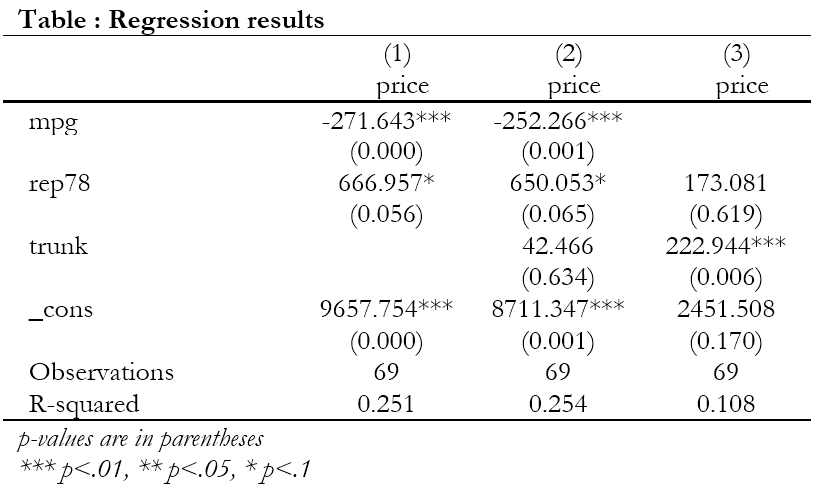
Please do remember to cite asdoc. To cite:
In-text citation
Tables were created using asdoc, a Stata program written by Shah (2018).Bibliography
Shah, A. (2018). ASDOC: Stata module to create high-quality tables in MS Word from Stata output. Statistical Software Components S458466, Boston College Department of Economics.-
This reply was modified 6 years, 4 months ago by
-
This reply was modified 6 years, 4 months ago by
-
This reply was modified 6 years, 4 months ago by
-
This reply was modified 6 years, 4 months ago by
-
This reply was modified 6 years, 4 months ago by
-
This reply was modified 6 years, 4 months ago by
-
This reply was modified 6 years, 4 months ago by
-
This reply was modified 6 years, 4 months ago by
-
This reply was modified 6 years, 4 months ago by
-
This reply was modified 6 years, 3 months ago by
-
AuthorPosts