

Forum Replies Created
-
AuthorPosts
-
in reply to: asdoc export regression error invalid Yes #5849
There are three issues in your code. The first two issues are related to adding a space between option and parenthesis. See the following two corrections.
Instead ofsave (Chapter_1_Tables)usesave(Chapter_1_Tables)
Instead ofadd (Industry Effects, Yes, Year Effects, Yes)useadd(Industry Effects, Yes, Year Effects, Yes)And the third issue is the use of add() option without using the nest option. add() option works only when you are nesting regression tables. Therefore, this option will be ignored as asdoc will be outputting the detailed regression table when option nest is not used.
asdocx is now available
A more powerful and flexible version of asdoc is now available. I call it asdocx. You may like to check the details herePlease do remember to cite asdoc. To cite:
In-text citation
Tables were created using asdoc, a Stata program written by Shah (2018).Bibliography
Shah, A. (2018). ASDOC: Stata module to create high-quality tables in MS Word from Stata output. Statistical Software Components S458466, Boston College Department of Economics.Hello Susan
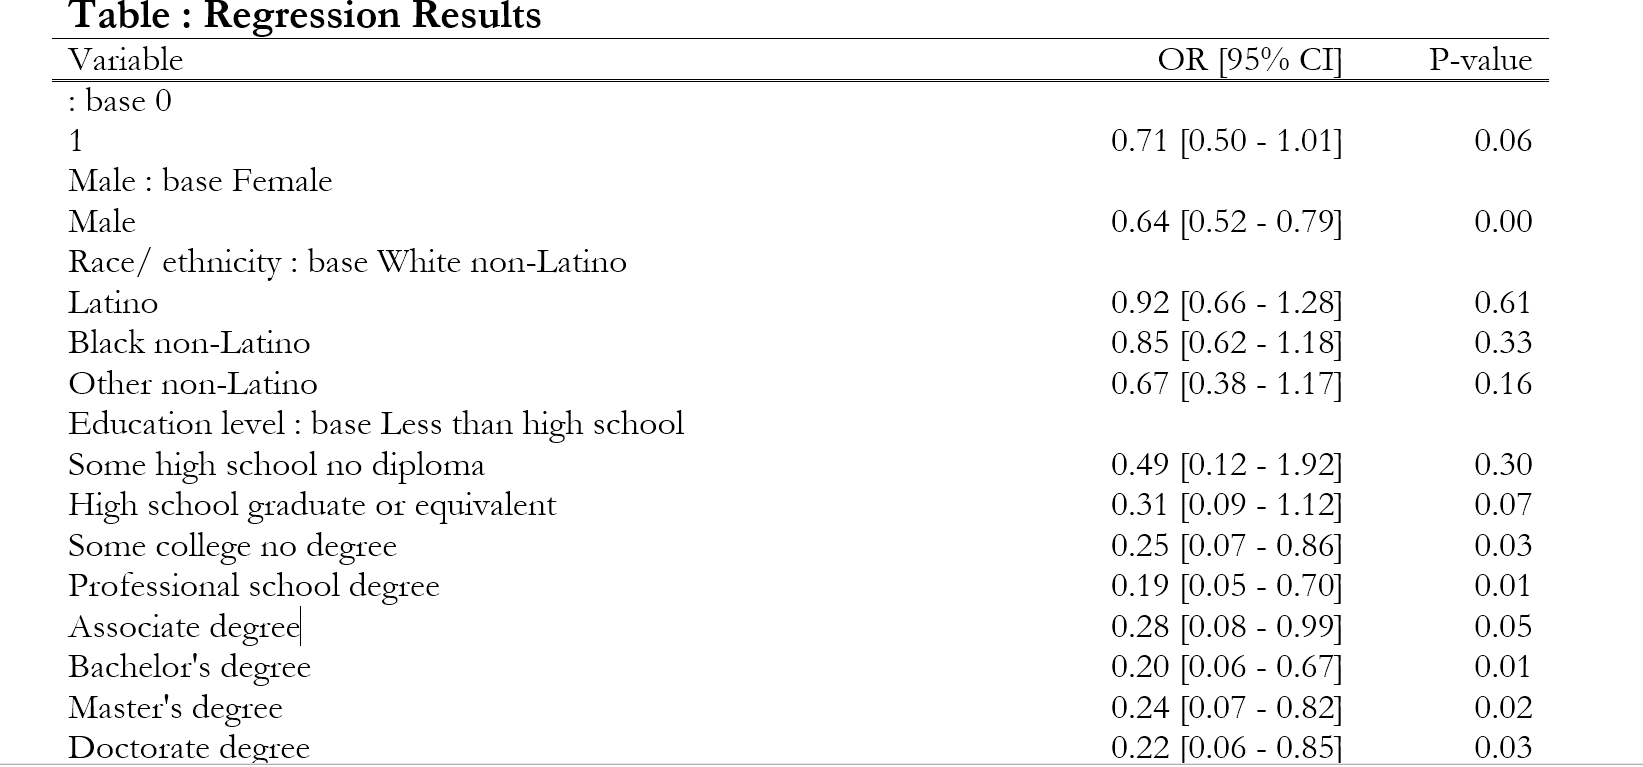
Thanks for using asdoc. I made such a template in asdocx. You can see the layout / output created by this template here https://fintechprofessor.com/asdocx/forums/topic/nested-regression-with-confidence-intervals-with-asdocx/. If you have a suggestion or modification, I can add it to the template. asdocx has many other features that asdoc does not have, you may like to see the differences here https://fintechprofessor.com/asdocx/difference-between-asdocx-and-asdoc/.Here is a picture of a sample table created by asdocx
Dear Ariful Islam
asdoc follows the Stata official allowed statistic with the sum command. These statistics include :p1 1st percentile p5 5th percentile p10 10th percentile p25 25th percentile median median (same as p50) p50 50th percentile (same as median) p75 75th percentile p90 90th percentile p95 95th percentile p99 99th percentile iqr interquartile range = p75 - p25 q equivalent to specifying p25 p50 p75That means statistics at 80th percentiles are not available. If you need it, you an use asdocx https://fintechprofessor.com/asdocx/, which I shall modify to accept 80th percentile.
in reply to: Using asdocx with un-paired t-test in Stata #5714Thanks for reporting this. I have fixed the issue. The current version of asdoc is
Code:
*! Version 2.3.9.3 : Changes made on Jan 1, 2021
The new version of asdoc can be installed from my site. Copy and paste the following line in Stata and press enter.net install asdoc, from(http://fintechprofessor.com) replace
Please note that the above line has to be copied in full. After installation of the new version, then restart Stata.asdocx is now available
A more powerful and flexible version of asdoc is now available. I call it asdocx. You may like to check the details here
Please do remember to cite asdoc. To cite:
In-text citation
Tables were created using asdoc, a Stata program written by Shah (2018).Bibliography
Shah, A. (2018). ASDOC: Stata module to create high-quality tables in MS Word from Stata output. Statistical Software Components S458466, Boston College Department of Economics.in reply to: Converting daily returns to weekly returns in Stata #5692Hello Nathan
To convert daily returns to weekly, you can either use asrol or ascol. Both of them employ similar methods, though ascol is specifically designed for this task. The help file of ascol provides several examples in this regard. You might also find this blog entry helpful. In the following paragraph, I show one additional example using data from my site.* Install ascol from SSC
ssc install ascol
* Generate log returns bys symbol : gen daily_return = ln(close / close[_n-1]) * Create weekly date gen week_date = wofd(date) format week_date %tw * Convert the daily returns to weekly ascol daily_return , returns(log) keep(all) toweek gen(weekly_return) timevar(date) panelvar(symbol)Explanation
returns(log) : Tells ascol that the returns were initially generated using log method. This is important because ascol then applies the simple summation method to convert the returns from daily to weekly frequency.
keep(all): When we convert data from daily to a lower-frequency such as weekly, monthly, etc., we end up with repeated values of the converted variable. We often just need one value of the variable per cross-sectional unit and time-period. Therefore, the repeated observations are not needed and should be dropped. This is what the Stata’s collapse command does. The default in ascol is to collapse the data to a lower frequency and delete all other variables except the newly created one. However, there might be circumstances when we want to retain all the observations without collapsing the data set. Towards this end, we can use the option keep(all) or keep(vars). keep(all) will keep the data set as it was before running the command, while keep(vars) will collapse the data to a lower frequency and keep all the variables of the data set. Here is the summary:
keep(all) conversion happens without collapsing the data and without deleting other variables
keep(vars) conversion happens without deleting other variables; data collapses to a lower frequency
timevar(date) panelvar(symbol) : If the data is already declared as panel with the tsset, these two options are not required. If the data is declared as panel data, then timevar() is used to declare the time variable and panelvar() is used to declare the panel variable, here it is the company symbol.
Try removing the
add(citation)from the command and let me know if that causes the issue. I shall add an option of cite to generate the citation.You can use table command for this. see this example
sysuse nlsw88
asdoc table industry , contents(n age mean age mean wage)
asdocx is now available
A more powerful and flexible version of asdoc is now available. I call it asdocx. You may like to check the details here https://fintechprofessor.com/asdocxPlease do remember to cite asdoc. To cite:
In-text citation
Tables were created using asdoc, a Stata program written by Shah (2018).Bibliography
Shah, A. (2018). ASDOC: Stata module to create high-quality tables in MS Word from Stata output. Statistical Software Components S458466, Boston College Department of Economics.

Hello Molnar
Since I cannot replicate the problem you are referring to. For the record, asreg does not do any extrapolation. If the dependent variable is missing, it shall create missing output.Please identify any unexpected results in the following code and the results shown below the code.
*Create some dummy data set obs 100 gen company_id = _n expand 20 bys company_id : gen year = _n + 1980 gen dep_var = uniform() gen x1 = uniform() gen x2 = uniform() gen x3 = uniform() replace dep_var = . in 10 *rolling window regression asreg dep_var x1 x2 x3, window(year 5) by(company_id ) *Note that the results are missing for observation 5 as I set the dep_var equal to missing in observation 10 . list company_id year dep_var x1 x2 x3 _b_x1 _b_x2 _b_x3 _b_cons in 1/20 +-----------------------------------------------------------------------------------------------------------------+ | compan~d year dep_var x1 x2 x3 _b_x1 _b_x2 _b_x3 _b_cons | |-----------------------------------------------------------------------------------------------------------------| 1. | 1 1981 .9472316 .4128598 .722326 .5578895 . . . . | 2. | 1 1982 .0522234 .7549242 .5103776 .7870066 . . . . | 3. | 1 1983 .9743183 .552299 .8967206 .7550112 . . . . | 4. | 1 1984 .9457484 .5891278 .3083104 .3083135 . . . . | 5. | 1 1985 .1856478 .697482 .909019 .1549393 -3.0732114 -.33335542 .01013383 2.6870112 | |-----------------------------------------------------------------------------------------------------------------| 6. | 1 1986 .9487334 .4505732 .3013251 .9282259 -3.6761877 -.03146574 -.21259752 3.002839 | 7. | 1 1987 .8825376 .3878326 .1245625 .0175663 -1.0323297 -.3133134 .40717164 1.3231022 | 8. | 1 1988 .9440776 .4846907 .2986447 .337576 1.1819022 -1.4298679 .25653229 .63017369 | 9. | 1 1989 .0894259 .4338235 .3440744 .758045 13.829088 -6.3155436 .27149413 -3.7996463 | 10. | 1 1990 . .8449519 .6950497 .3233008 . . . . | |-----------------------------------------------------------------------------------------------------------------| 11. | 1 1991 .9484983 .4248196 .3894849 .6740687 2.953628 -.73021252 -.22957358 -.18853085 | 12. | 1 1992 .1121626 .2664079 .2287498 .327188 2.3396352 6.3272919 -2.740214 -.93388601 | 13. | 1 1993 .4809064 .5369344 .9809995 .649418 3.8529128 -.62252069 -.68318142 -.4848008 | 14. | 1 1994 .9763448 .3829168 .1949201 .9513145 -2.8998911 .73232787 1.7772335 .19997632 | 15. | 1 1995 .1254975 .0192644 .8068066 .2702817 -.05386859 -.11403092 1.3741806 -.18383902 | |-----------------------------------------------------------------------------------------------------------------| 16. | 1 1996 .7655026 .0001751 .4510984 .3024662 -1.1119095 -.02674897 1.5406791 .00390702 | 17. | 1 1997 .0358593 .1630308 .9948465 .944969 .89422509 -1.0497158 -.30523184 1.1898735 | 18. | 1 1998 .0702359 .7856113 .7915192 .5903638 -.28049067 -1.3305861 .1390848 1.2473779 | 19. | 1 1999 .2101787 .177225 .2381918 .0603619 -.36437884 -.75992844 .31518871 .68711351 | 20. | 1 2000 .6616006 .0859762 .7393021 .1151739 -.54199642 .46124685 -.71506168 .47141122 | +-----------------------------------------------------------------------------------------------------------------+in reply to: asdoc The Current Directory is not writable | Stata #5633Akanksha
The message of asdoc is quite detailed and reports a possible solution to the problem. Let me discuss first the circumstance why this happens, and then discuss the solution.Why this message is shown
asdoc first checks whether it can write output to the current directory. By default, Stata sets the installation folder as a working directory. This might be a system folder where write-protection is enabled. If asdoc cannot write to this directory, it will not proceed further and generate the error message.What is the solution
The solution is to create a directory where you can the write-permission. Once the directory is create, you can change to that directory by typeingcd
Suppose you created a directory in C folder with the name results, then to change to that directory, type this in Stata
cd C:/results
And then use asdoc.asdocx is now available
A more powerful and flexible version of asdoc is now available. I call it asdocx. You may like to check the details here https://fintechprofessor.com/asdocxPlease do remember to cite asdoc. To cite:
In-text citation
Tables were created using asdoc, a Stata program written by Shah (2018).Bibliography
Shah, A. (2018). ASDOC: Stata module to create high-quality tables in MS Word from Stata output. Statistical Software Components S458466, Boston College Department of Economics.
-
This reply was modified 5 years, 6 months ago by
Attaullah Shah.
in reply to: asdoc tabstat by country error | Stata Ms Word #5631Muhammad Ilyas
I think I shall fix this and update asdoc. At the moment, can you lease try and let me know the whether the following code works. The catch is you need to add a space between
,andstatasdoc tabstat esg, stat(mean) by(country) replace
asdocx is now available
A more powerful and flexible version of asdoc is now available. I call it asdocx. You may like to check the details here https://fintechprofessor.com/asdocxPlease do remember to cite asdoc. To cite:
In-text citation
Tables were created using asdoc, a Stata program written by Shah (2018).Bibliography
Shah, A. (2018). ASDOC: Stata module to create high-quality tables in MS Word from Stata output. Statistical Software Components S458466, Boston College Department of Economics.
-
This reply was modified 5 years, 6 months ago by
Hello Yen
I have implemented it asdocx, that has many other useful features. You can find more about asdocx here https://fintechprofessor.com/asdocx/in reply to: Stata export tabulate two variables with asdoc #5484You can use the latest version of asdoc (Version 2.3.9.1 : Changes made on October 30, 2020). It creates the mentioned table without any issue. See the following example:
The new version of asdoc can be installed from my site. Copy and paste the following line in Stata and press enter.net install asdoc, from(http://fintechprofessor.com) replace
Please note that the above line has to be copied in full. After installation of the new version, then restart Stata.
sysuse nlsw88, clear
asdoc tabulate married collgrad, col replace


           |   college graduate
   married | not colle  college g |     Total
-----------+----------------------+----------
    single |       616        188 |       804
           |     35.94      35.34 |     35.80
-----------+----------------------+----------
   married |     1,098        344 |     1,442
           |     64.06      64.66 |     64.20
-----------+----------------------+----------
     Total |     1,714        532 |     2,246
           |    100.00     100.00 |    100.00
Click to Open File:  Myfile.doc
asdocx is now available
A more powerful and flexible version of asdoc is now available. I call it asdocx. You may like to check the details here https://fintechprofessor.com/asdocxPlease do remember to cite asdoc. To cite:
In-text citation
Tables were created using asdoc, a Stata program written by Shah (2018).Bibliography
Shah, A. (2018). ASDOC: Stata module to create high-quality tables in MS Word from Stata output. Statistical Software Components S458466, Boston College Department of Economics.
-
This reply was modified 5 years, 7 months ago by
in reply to: Leading zero in asdoc table | Stata #5439Hello Brinda
I have implemented it asdocx, that has many other useful features. You can find more about asdocx here https://fintechprofessor.com/asdocx/-
This reply was modified 5 years, 6 months ago by
in reply to: asreg with single variable | Stata #4829Hello Paul
Thanks for the suggestion and contributing to asreg. I hope it will be useful for many other members of the asreg community. I shall implement these changes in the coming version 5.0 of asreg, which has a significant speed advantage and has a new flexible window.Hello Nick
The error message that you are receiving is not from the asdoc command, it is from theneweycommand. Theneweycommand throws this error when there are time series gaps in your data. However, you can use theforceoption to ignore the gaps. Since asdoc also has theforceoption, there was a contradiction. I have fixed it now,asdoc version 2.3.8.7 : Changes made on Sep 9, 2020.The new version of asdoc can be installed from my site. Copy and paste the following line in Stata and press enter.
net install asdoc, from(http://fintechprofessor.com) replace
Please note that the above line has to be copied in full. After installation of the new version, then restart Stata.
asdocx is now available
A more powerful and flexible version of asdoc is now available. I call it asdocx. You may like to check the details herePlease do remember to cite asdoc. To cite:
In-text citation
Tables were created using asdoc, a Stata program written by Shah (2018).Bibliography
Shah, A. (2018). ASDOC: Stata module to create high-quality tables in MS Word from Stata output. Statistical Software Components S458466, Boston College Department of Economics. -
This reply was modified 5 years, 6 months ago by
-
AuthorPosts