

Forum Replies Created
-
AuthorPosts
-
in reply to: asdoc for nested regression tables #4823
Hello Erik
You can check the version of asdoc by typingwhich asdoc
The current version is
Version 2.3.8.6 : Changes made on Sep 4, 2020
The new version of asdoc can be installed from my site. Copy and paste the following line in Stata and press enter.
net install asdoc, from(http://fintechprofessor.com) replace
Please note that the above line has to be copied in full. After installation of the new version, then restart Stata.
asdocx is now available
A more powerful and flexible version of asdoc is now available. I call it asdocx. You may like to check the details herePlease do remember to cite asdoc. To cite:
In-text citation
Tables were created using asdoc, a Stata program written by Shah (2018).
Bibliography
Shah, A. (2018). ASDOC: Stata module to create high-quality tables in MS Word from Stata output. Statistical Software Components S458466, Boston College Department of Economics.
in reply to: 12 month rolling percentiles #4780Mike
I have updated asrol and now multiple statistics / variables can be used in one command. The new version of asdoc can be installed from my site. Copy and paste the following line in Stata and press enter.net install asrol, from(http://fintechprofessor.com) replace
Please note that the above line has to be copied in full. After installation of the new version, then restart Stata.
Here are few examples:
*Example1: Find mean in a rolling window of -10 and -1 years for two variables: invest and mvalue

webuse grunfeld, clear
asrol invest mvalue , stat(mean) wind(year -10 -1)

*Example2: Find median and mean for a single variable: invest
asrol invest, stat(median mean) window(year -11 -1)
-
This reply was modified 5 years, 9 months ago by
Attaullah Shah.
in reply to: tabulate with column option in asdoc | Stata #4779Hello MXC
I have fixed this issue. The current version of asdoc isVersion 2.3.8.6 : Changes made on Sep 4, 2020
The new version of asdoc can be installed from my site. Copy and paste the following line in Stata and press enter.
net install asdoc, from(http://fintechprofessor.com) replace
Please note that the above line has to be copied in full. After installation of the new version, then restart Stata.
asdocx is now avaialble
A more powerful and flexible version of asdoc is now available. I call it asdocx. You may like to check the details herePlease do remember to cite asdoc. To cite:
In-text citation
Tables were created using asdoc, a Stata program written by Shah (2018).Bibliography
Shah, A. (2018). ASDOC: Stata module to create high-quality tables in MS Word from Stata output. Statistical Software Components S458466, Boston College Department of Economics.in reply to: Help: Syntax error w/ asdoc sum #4676Copy and paste the following line in Stata and press enter.
net install asdoc, from(http://fintechprofessor.com) replacePlease note that the above line has to be copied in full. After installation of the new version, then restart Stata.
asdocx is now available
A more powerful and flexible version of asdoc is now available. I call it asdocx. You may like to check the details herePlease do remember to cite asdoc. To cite:
In-text citation
Tables were created using asdoc, a Stata program written by Shah (2018).Bibliography
Shah, A. (2018). ASDOC: Stata module to create high-quality tables in MS Word from Stata output. Statistical Software Components S458466, Boston College Department of Economics.in reply to: 12 month rolling percentiles #4642The new version is not yet uploaded to the SSC, therefore, you need to install it from my site.
The new version of asdoc can be installed from my site. Copy and paste the following line in Stata and press enter.net install asrol, from(http://fintechprofessor.com) replace
Please note that the above line has to be copied in full. After installation of the new version, then restart Stata.
For rolling percentiles with for several variables, there is no need to use loop, you can specify many variables with asrol.
asrol iv v , stat(median) perc(.1) window(month_id -12 -1)
asrol iv v , stat(median) perc(.99) window(month_id -12 -1)
in reply to: ASDOC regressions by year in Stata #4628Swathi
Thanks for reporting this.I have fixed the issue. asdoc can now support more than 20 nested regression tables. Since you are running and nesting lots of regressions, you are more likely to be hit the MS Word formatting issues that accrue with large tables. Therefore, you might like to do the following once you open the table in MS Word:
1. Convert the page setup to Landscape
2. Click inside the table, and then click on the ‘Layout’ menu, then choose autofit contents.
3. Copy full table from MS Word and paste in ExcelThe new version of asdoc can be installed from my site. Copy and paste the following line in Stata and press enter.
net install asdoc, from(http://fintechprofessor.com) replacePlease note that the above line has to be copied in full. After installation of the new version, then restart Stata.
Please do remember to cite asdoc. To cite:
In-text citation
Tables were created using asdoc, a Stata program written by Shah (2018).Bibliography
Shah, A. (2018). ASDOC: Stata module to create high-quality tables in MS Word from Stata output. Statistical Software Components S458466, Boston College Department of Economics.-
This reply was modified 5 years, 9 months ago by
in reply to: CAPM with ASREG in Stata using Hourly Data #4617The following statistics show that there are gaps in your range variable – hours. Due to these gaps, you never achieve the maximum number of observations in your regression. The max goes to 17508. And in some cases, the gap is 191 periods.
bys group: asreg ret btcret, wind (hours 17520) Variable | Obs Mean Std. Dev. Min Max -------------+--------------------------------------------------------- _Nobs | 55,984 14057.27 4615.921 3 17508 _R2 | 55,984 .286359 .16784 4.19e-06 .6340864 _adjR2 | 55,984 .2861602 .1681217 -.441666 .6340654 _b_btcret | 55,984 .8394192 .3598068 -1.821103 69.31989 _b_cons | 55,984 .0003909 .0014452 -.2672959 .0135633 . bys group (hours ) : gen dif = hours - hours[_n-1] (1 missing value generated) . sum dif Variable | Obs Mean Std. Dev. Min Max -------------+--------------------------------------------------------- dif | 56,001 1.101266 1.175469 1 191in reply to: CAPM with ASREG in Stata using Hourly Data #4340Thanks for your feedback. Can you please share some data (real or fake) so that I can reproduce the error. There is no internal limitation on maximum number of observations in asreg.
Prerak
I was investigating the issue in tabulate command, while your example now shows that it was related to the table command. I have fixed the issue now.
The new version of asdoc can be installed from my site. Copy and paste the following line in Stata and press enter.net install asdoc, from(http://fintechprofessor.com) replace
Please note that the above line has to be copied in full. After installation of the new version, then restart Stata.
asdocx is now available
It is now almost three years in developing asdoc and constantly adding features to it. With the addition of _docx and xl() classes to Stata, it is high time to add support for native docx and xlsx output to asdoc. Also, given that there exists a significant number of LaTeX users, asdoc should be able to create LaTeX documents. It gives me immense pleasure to annouce asdocx that is not only more flexible in making customized tables, but also creates documents in native docx, xlsx, rtf, and .tex formats. If you have enjoyed and find asdoc useful, please consider buying a copy of asdocx to support its development. You may like to check the details herePlease do remember to cite asdoc. To cite:
In-text citation
Tables were created using asdoc, a Stata program written by Shah (2018).Bibliography
Shah, A. (2018). ASDOC: Stata module to create high-quality tables in MS Word from Stata output. Statistical Software Components S458466, Boston College Department of Economics.Hello Prerak
I have not understood your question. Please remember to quote a reproducible example. Here are the outputs from asdoc and Stata tab commands when using without asdoc.*Official tabulate example Repair | Record | Car type 1978 | Domestic Foreign | Total -----------+----------------------+---------- 1 | 2 0 | 2 | 100.00 0.00 | 100.00 -----------+----------------------+---------- 2 | 8 0 | 8 | 100.00 0.00 | 100.00 -----------+----------------------+---------- 3 | 27 3 | 30 | 90.00 10.00 | 100.00 -----------+----------------------+---------- 4 | 9 9 | 18 | 50.00 50.00 | 100.00 -----------+----------------------+---------- 5 | 2 9 | 11 | 18.18 81.82 | 100.00 -----------+----------------------+---------- Total | 48 21 | 69 | 69.57 30.43 | 100.00 *asdoc table asdoc tab rep78 foreign, replace row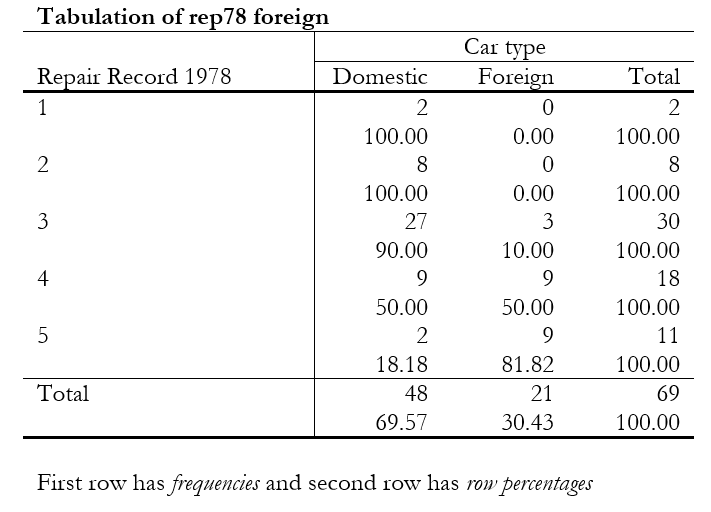
You can compare these outputs and tell me where do they differ?
-
This reply was modified 5 years, 10 months ago by
in reply to: Equal and weighted mean with asgen in Stata #4103Dan
Yes, you are right in both the statements.in reply to: How to report p-values in asdoc nested table #4035Please post your code to reproduce the error.
in reply to: How to report p-values in asdoc nested table #4027Sometimes this happens due to incomplete transfer of files from the server. The new version of asdoc can be installed from my site. Copy and paste the following line in Stata and press enter.
net install asdoc, from(http://fintechprofessor.com) replacePlease note that the above line has to be copied in full. After installation of the new version, then restart Stata.
asdocx is now avaialble
A more powerful and flexible version of asdoc is now available. I call it asdocx. You may like to check the details herePlease do remember to cite asdoc. To cite:
In-text citation
Tables were created using asdoc, a Stata program written by Shah (2018).Bibliography
Shah, A. (2018). ASDOC: Stata module to create high-quality tables in MS Word from Stata output. Statistical Software Components S458466, Boston College Department of Economics.in reply to: rolling command panel data #4014This can be easily done using asrol. Let’s assume that your panel identifier is
idand time identifier isyear. The asrol code you would use is given below.bysort id : asrol ebitda, gen(sd_ebitda) stat(sd) window(year 4) min(4)
The min(4) option ensures that at least 4 observations are available for the calculation of the standard deviation.
in reply to: Combine wide and nest #3994This is not possible using the wide and nest options together. However, such customized tables can be easily made with the new asdocx. Here is the code to be used with asdocx
*Add the first header row
asdocx addrow, data(Effect of mpg, in Model 1, in Model2) col(1) row(1)

*The Regressions
reg price mpg rep78
loc mpg1 = _b[mpg]
reg price mpg rep78 headroom
loc mpg2 = _b[mpg]

*Now write the complete row
asdocx addrow, data(on price, `mpg1' , `mpg2') col(1) row(2) dec(3)

*Another set of regressions
reg trunk mpg rep78
loc mpg1 = _b[mpg]
reg trunk mpg rep78 headroom
loc mpg2 = _b[mpg]

*Write another row
asdocx addrow, data(on trunk,  `mpg1' , `mpg2') col(1) row(3) dec(3)

*And then export to Word
asdocx export
It  produces the following output

----+---------------------------------------------
  1 |Effect of mpg         in Model 1   in Model2
----+---------------------------------------------
  2 |on price                -271.643    -289.346
  3 |on trunk                  -0.456      -0.303
--------------------------------------------------
Moreover, if this is something you need frequently, you easily create a template file with the above code and use it with asdocx.
-
This reply was modified 5 years, 10 months ago by
-
This reply was modified 5 years, 10 months ago by
-
This reply was modified 5 years, 10 months ago by
-
This reply was modified 5 years, 10 months ago by
-
This reply was modified 5 years, 10 months ago by
-
This reply was modified 5 years, 10 months ago by
-
This reply was modified 5 years, 10 months ago by
-
This reply was modified 5 years, 9 months ago by
-
AuthorPosts